


You also want an ePaper? Increase the reach of your titles
YUMPU automatically turns print PDFs into web optimized ePapers that Google loves.
IFTA JOURNAL<br />
2017 EDITION<br />
The Relative Strength Index (RSI) as<br />
an Oscillator<br />
The RSI is a technical indicator invented by J. Welles Wilder<br />
and documented in his 1978 book, New Concepts in Technical<br />
Trading Systems. 4 The RSI indicator is one of the most popular<br />
technical analysis indicators available to users and is commonly<br />
found as a default internal indicator to many technical analysis<br />
software packages. The RSI is calculated on the basis of the<br />
speed and direction of a stock or index’s price movement. It<br />
measures the stock or index’s internal strength by comparing<br />
the magnitude of recent gains to recent losses. A common<br />
look-back period for the RSI is 14 trading periods, which then<br />
becomes the popular RSI (14) indicator. The RSI (14) calculation<br />
is found in Equation 1 below, whereby the ratio of the average<br />
gains/average losses over the prior 14 trading periods is known<br />
as the Relative Strength (RS). The RS is calculated into the RSI<br />
(14) as a normalized index (between 0 and 100) through the<br />
second part of Equation 1.<br />
Equation 1. The RSI (14) calculation<br />
The RSI as a Trend Trading Indicator<br />
Although Wilder created the RSI (14) indicator, Andrew<br />
Cardwell is recognized today by many technical analysts as<br />
a leading authority on the RSI (14). Cardwell’s research on<br />
the indicator has “opened the door to new methods of using<br />
oscillators in general for trend following and price projection.” 5<br />
Cardwell employs two moving averages, which smooth the<br />
RSI (14) values: the 9-period simple moving average (SMA) and<br />
the 45-period exponential moving average (EMA). When used<br />
together, these two moving averages help diagnose RSI (14)<br />
trend direction. 6<br />
In RSI: The Complete Guide (2004), John Hayden suggests that<br />
to confirm a bullish RSI (14) trend, the 9-period RSI (14) SMA<br />
must cross above the 45-period RSI (14) EMA. 7 Further, Walter<br />
Baeyens, in RSI: Logic, Signals & Time Frame Correlation (2007),<br />
discusses the importance of using Cardwell’s application of<br />
9-period SMA and 45-period EMA crossovers on both price and<br />
RSI (14) to confirm buy-and-sell signals. 8<br />
The 9-period SMA calculation is defined by Equation 2, and the<br />
45-period EMA is defined by Equation 3.<br />
Equation 2. The RSI (14) nine period simple moving average<br />
calculation<br />
Equation 3. The RSI(14) 45-period exponential moving average<br />
calculation<br />
EMA Today =a∗ [(RSI(14 cp ))−(RSI(14 EMA_ pp ))]+[(RSI(14 EMA_ pp ))]<br />
Where:<br />
a = Acceleration Factor (or, 2 / (No. of period’s EMA + 1) cp =<br />
current period’s RSI (14) close value.EMA pp = previous periods<br />
RSI (14) EMA value.<br />
A Modified Use of the RSI Trend<br />
Trading Indicator<br />
The RSI (14) trend-trading model proposed in this paper is a<br />
moving-average-based trading system. Cardwell’s extensive<br />
research on the RSI (14) provides evidence that using two<br />
moving averages, one short-term (9-period SMA) and one<br />
longer-term (45-period EMA), is useful in assessing trend<br />
direction. The RSI (14) trend-trading model is based on the<br />
application of the 9-period SMA and 45-period EMA compared<br />
against the RSI (14) line. Cardwell and other published research<br />
suggest that trade signals are generated after a 9-period SMA<br />
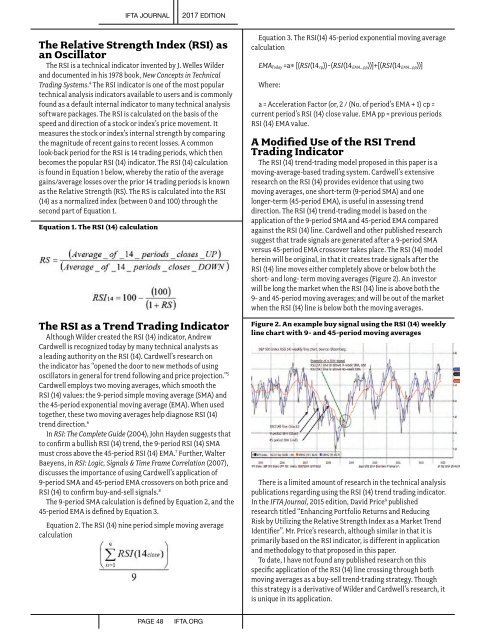
versus 45-period EMA crossover takes place. The RSI (14) model<br />
herein will be original, in that it creates trade signals after the<br />
RSI (14) line moves either completely above or below both the<br />
short- and long- term moving averages (Figure 2). An investor<br />
will be long the market when the RSI (14) line is above both the<br />
9- and 45-period moving averages; and will be out of the market<br />
when the RSI (14) line is below both the moving averages.<br />
Figure 2. An example buy signal using the RSI (14) weekly<br />
line chart with 9- and 45-period moving averages<br />
There is a limited amount of research in the technical analysis<br />
publications regarding using the RSI (14) trend trading indicator.<br />
In the IFTA Journal, 2015 edition, David Price 9 published<br />
research titled “Enhancing Portfolio Returns and Reducing<br />
Risk by Utilizing the Relative Strength Index as a Market Trend<br />
Identifier”. Mr. Price’s research, although similar in that it is<br />
primarily based on the RSI indicator, is different in application<br />
and methodology to that proposed in this paper.<br />
To date, I have not found any published research on this<br />
specific application of the RSI (14) line crossing through both<br />
moving averages as a buy-sell trend-trading strategy. Though<br />
this strategy is a derivative of Wilder and Cardwell’s research, it<br />
is unique in its application.<br />
PAGE 48<br />
IFTA.ORG