


You also want an ePaper? Increase the reach of your titles
YUMPU automatically turns print PDFs into web optimized ePapers that Google loves.
IFTA JOURNAL<br />
2017 EDITION<br />
Table 4. Performance statistics for two secular bull markets<br />
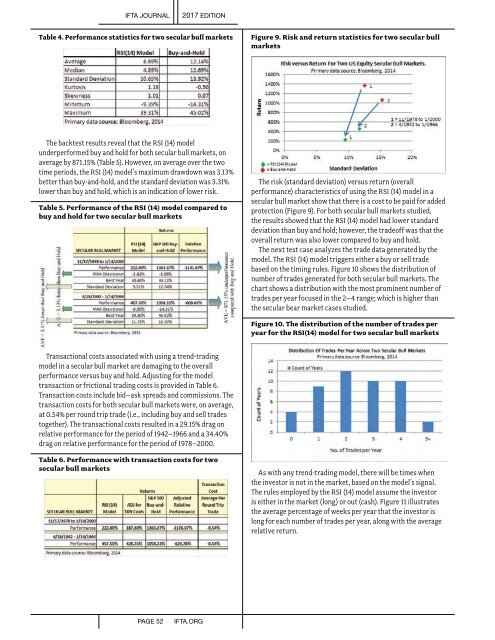
Figure 9. Risk and return statistics for two secular bull<br />
markets<br />
The backtest results reveal that the RSI (14) model<br />
underperformed buy and hold for both secular bull markets, on<br />
average by 871.15% (Table 5). However, on average over the two<br />
time periods, the RSI (14) model’s maximum drawdown was 3.13%<br />
better than buy-and-hold, and the standard deviation was 3.31%<br />
lower than buy and hold, which is an indication of lower risk.<br />
Table 5. Performance of the RSI (14) model compared to<br />
buy and hold for two secular bull markets<br />
The risk (standard deviation) versus return (overall<br />
performance) characteristics of using the RSI (14) model in a<br />
secular bull market show that there is a cost to be paid for added<br />
protection (Figure 9). For both secular bull markets studied,<br />
the results showed that the RSI (14) model had lower standard<br />
deviation than buy and hold; however, the tradeoff was that the<br />
overall return was also lower compared to buy and hold.<br />
The next test case analyzes the trade data generated by the<br />
model. The RSI (14) model triggers either a buy or sell trade<br />
based on the timing rules. Figure 10 shows the distribution of<br />
number of trades generated for both secular bull markets. The<br />
chart shows a distribution with the most prominent number of<br />
trades per year focused in the 2–4 range; which is higher than<br />
the secular bear market cases studied.<br />
Figure 10. The distribution of the number of trades per<br />
year for the RSI(14) model for two secular bull markets<br />
Transactional costs associated with using a trend-trading<br />
model in a secular bull market are damaging to the overall<br />
performance versus buy and hold. Adjusting for the model<br />
transaction or frictional trading costs is provided in Table 6.<br />
Transaction costs include bid–ask spreads and commissions. The<br />
transaction costs for both secular bull markets were, on average,<br />
at 0.54% per round trip trade (i.e., including buy and sell trades<br />
together). The transactional costs resulted in a 29.15% drag on<br />
relative performance for the period of 1942–1966 and a 34.40%<br />
drag on relative performance for the period of 1978–2000.<br />
Table 6. Performance with transaction costs for two<br />
secular bull markets<br />
As with any trend-trading model, there will be times when<br />
the investor is not in the market, based on the model’s signal.<br />
The rules employed by the RSI (14) model assume the investor<br />
is either in the market (long) or out (cash). Figure 11 illustrates<br />
the average percentage of weeks per year that the investor is<br />
long for each number of trades per year, along with the average<br />
relative return.<br />
PAGE 52<br />
IFTA.ORG