


Create successful ePaper yourself
Turn your PDF publications into a flip-book with our unique Google optimized e-Paper software.
IFTA JOURNAL<br />
2017 EDITION<br />
Clarification of the Calculation<br />
Method of the Target Levels of<br />
Japanese Candlestick Patterns by<br />
Using Patterns Confirmation Filters<br />
The following is a detailed explanation of the method of this<br />
study for calculating the target levels of Japanese candlestick<br />
patterns.<br />
Figure 2. Siemens (SIEGn.DE) from 05-03-2009 to 01-10-<br />
2009: An example of how to calculate the bullish target<br />
100% of thrusting pattern (successful pattern)<br />
The Positive Closing Above the Upper Filter<br />
This closing is considered as confirmation for the positive<br />
Japanese candlestick patterns (or failure for the negative<br />
Japanese candlestick patterns), and you can use the following<br />
mathematical equations to calculate the targets of the positive<br />
closing above the upper filter based on the Fibonacci ratios<br />
(61.8%, 50%, 38.2%, and 23.6%) in addition to the 100% ratio:<br />
• Bullish Target 100% = F2 + [(F1 - F2) × N]<br />
• Bullish Target 61.8% = F2 + [(F1 - F2) × N × 0.618]<br />
• Bullish Target 50% = F2 + [(F1 - F2) × N × 0.50]<br />
Figure 3. BT Group (BT.L) from 01-11-2010 to 16-05-2011:<br />
An Example of how to calculate the bullish target 61.8%<br />
of dark cloud cover pattern (failed pattern)<br />
• Bullish Target 38.2% = F2 + [(F1 - F2) × N × 0.382]<br />
• Bullish Target 23.6% = F2 + [(F1 - F2) × N × 0.236]<br />
Where:<br />
F1: upper filter level.<br />
F2: lower filter level.<br />
N: Number of candles that closed between the upper filter<br />
level (F1) and the lower filter level (F2) of Japanese candlestick<br />
pattern.<br />
Figures 1 through 5 show examples of how to calculate the<br />
bullish target levels.<br />
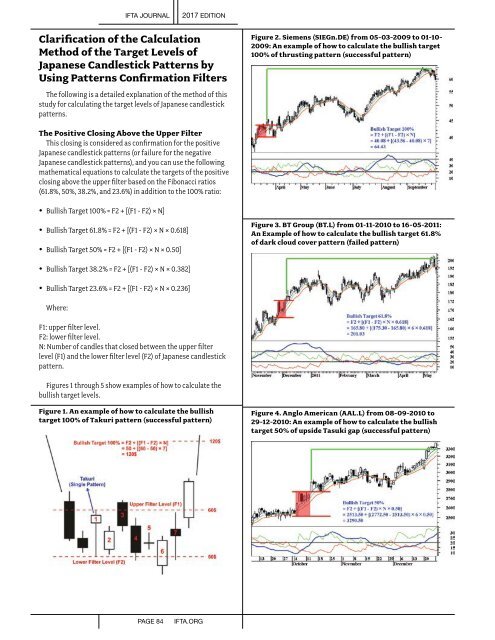
Figure 1. An example of how to calculate the bullish<br />
target 100% of Takuri pattern (successful pattern)<br />
Figure 4. Anglo American (AAL.L) from 08-09-2010 to<br />
29-12-2010: An example of how to calculate the bullish<br />
target 50% of upside Tasuki gap (successful pattern)<br />
PAGE 84<br />
IFTA.ORG