- Page 1 and 2:
STRATEGIC RETHINK STRATEGIC CHOICES
- Page 3 and 4:
Preface This is the sixth and final
- Page 5:
Preface v The RAND Strategic Rethin
- Page 8 and 9:
viii Strategic Choices for a Turbul
- Page 11 and 12:
Contents Preface...................
- Page 13: Contents xiii Middle East..........
- Page 17 and 18: Summary For more than seven decades
- Page 19 and 20: Summary xix deal with because of it
- Page 21 and 22: Summary xxi Familiarity does not ne
- Page 23 and 24: Summary xxiii Whatever else is on t
- Page 25 and 26: Summary xxv of richest Americans, i
- Page 27 and 28: Summary xxvii reexamination arises
- Page 29 and 30: Summary xxix Dwight Eisenhower—wh
- Page 31 and 32: Summary xxxi of ISIS, the migration
- Page 33 and 34: Acknowledgments RAND Corporation Pr
- Page 35 and 36: CHAPTER ONE Introduction What is Am
- Page 37 and 38: Introduction 3 that some allies hav
- Page 39 and 40: Introduction 5 of distrust of the g
- Page 41 and 42: Introduction 7 live with. Therefore
- Page 43 and 44: Introduction 9 Bruce Jones points o
- Page 45 and 46: Introduction 11 force decision make
- Page 47: Introduction 13 United States for l
- Page 51 and 52: CHAPTER TWO From Triumph to Stalema
- Page 53 and 54: From Triumph to Stalemate: The Loss
- Page 55 and 56: From Triumph to Stalemate: The Loss
- Page 57 and 58: From Triumph to Stalemate: The Loss
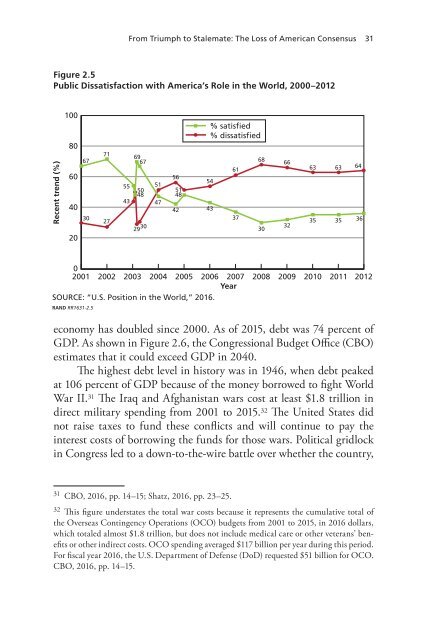
- Page 59 and 60: From Triumph to Stalemate: The Loss
- Page 61 and 62: From Triumph to Stalemate: The Loss
- Page 63: From Triumph to Stalemate: The Loss
- Page 67 and 68: From Triumph to Stalemate: The Loss
- Page 69 and 70: CHAPTER THREE Is the World Falling
- Page 71 and 72: Is the World Falling Apart (And How
- Page 73 and 74: Is the World Falling Apart (And How
- Page 75 and 76: Is the World Falling Apart (And How
- Page 77 and 78: Is the World Falling Apart (And How
- Page 79 and 80: Is the World Falling Apart (And How
- Page 81 and 82: Is the World Falling Apart (And How
- Page 83 and 84: Is the World Falling Apart (And How
- Page 85 and 86: Is the World Falling Apart (And How
- Page 87 and 88: Is the World Falling Apart (And How
- Page 89 and 90: Is the World Falling Apart (And How
- Page 91 and 92: Is the World Falling Apart (And How
- Page 93 and 94: Is the World Falling Apart (And How
- Page 95 and 96: Is the World Falling Apart (And How
- Page 97 and 98: Is the World Falling Apart (And How
- Page 99 and 100: Is the World Falling Apart (And How
- Page 101 and 102: Is the World Falling Apart (And How
- Page 103 and 104: Is the World Falling Apart (And How
- Page 105 and 106: Is the World Falling Apart (And How
- Page 107 and 108: Figure 3.4 Map of Climate Change Ho
- Page 109 and 110: CHAPTER FOUR Leveraging U.S. Streng
- Page 111 and 112: Leveraging U.S. Strengths, Dealing
- Page 113 and 114: Leveraging U.S. Strengths, Dealing
- Page 115 and 116:
Leveraging U.S. Strengths, Dealing
- Page 117 and 118:
Leveraging U.S. Strengths, Dealing
- Page 119 and 120:
Leveraging U.S. Strengths, Dealing
- Page 121 and 122:
Leveraging U.S. Strengths, Dealing
- Page 123 and 124:
Leveraging U.S. Strengths, Dealing
- Page 125 and 126:
Leveraging U.S. Strengths, Dealing
- Page 127 and 128:
Leveraging U.S. Strengths, Dealing
- Page 129 and 130:
Leveraging U.S. Strengths, Dealing
- Page 131 and 132:
Leveraging U.S. Strengths, Dealing
- Page 133 and 134:
Leveraging U.S. Strengths, Dealing
- Page 135 and 136:
Leveraging U.S. Strengths, Dealing
- Page 137:
Leveraging U.S. Strengths, Dealing
- Page 140 and 141:
106 Strategic Choices for a Turbule
- Page 142 and 143:
108 Strategic Choices for a Turbule
- Page 144 and 145:
110 Strategic Choices for a Turbule
- Page 146 and 147:
112 Strategic Choices for a Turbule
- Page 148 and 149:
114 Strategic Choices for a Turbule
- Page 150 and 151:
116 Strategic Choices for a Turbule
- Page 152 and 153:
118 Strategic Choices for a Turbule
- Page 154 and 155:
120 Strategic Choices for a Turbule
- Page 156 and 157:
122 Strategic Choices for a Turbule
- Page 158 and 159:
124 Strategic Choices for a Turbule
- Page 160 and 161:
126 Strategic Choices for a Turbule
- Page 162 and 163:
128 Strategic Choices for a Turbule
- Page 164 and 165:
130 Strategic Choices for a Turbule
- Page 166 and 167:
132 Strategic Choices for a Turbule
- Page 168 and 169:
134 Strategic Choices for a Turbule
- Page 171:
Part Two Strategic Choices
- Page 174 and 175:
140 Strategic Choices for a Turbule
- Page 176 and 177:
142 Strategic Choices for a Turbule
- Page 178 and 179:
144 Strategic Choices for a Turbule
- Page 180 and 181:
146 Strategic Choices for a Turbule
- Page 182 and 183:
148 Strategic Choices for a Turbule
- Page 184 and 185:
150 Strategic Choices for a Turbule
- Page 186 and 187:
152 Strategic Choices for a Turbule
- Page 188 and 189:
154 Strategic Choices for a Turbule
- Page 190 and 191:
156 Strategic Choices for a Turbule
- Page 192 and 193:
158 Strategic Choices for a Turbule
- Page 194 and 195:
160 Strategic Choices for a Turbule
- Page 196 and 197:
162 Strategic Choices for a Turbule
- Page 198 and 199:
164 Strategic Choices for a Turbule
- Page 200 and 201:
166 Strategic Choices for a Turbule
- Page 203 and 204:
CHAPTER EIGHT Option II: “The Ind
- Page 205 and 206:
Option II: “The Indispensable Nat
- Page 207 and 208:
Option II: “The Indispensable Nat
- Page 209 and 210:
Option II: “The Indispensable Nat
- Page 211 and 212:
Option II: “The Indispensable Nat
- Page 213 and 214:
Option II: “The Indispensable Nat
- Page 215 and 216:
CHAPTER NINE Option III: “Agile A
- Page 217 and 218:
Option III: “Agile America”: Ad
- Page 219 and 220:
Option III: “Agile America”: Ad
- Page 221 and 222:
Option III: “Agile America”: Ad
- Page 223 and 224:
Option III: “Agile America”: Ad
- Page 225 and 226:
Option III: “Agile America”: Ad
- Page 227 and 228:
Option III: “Agile America”: Ad
- Page 229 and 230:
Option III: “Agile America”: Ad
- Page 231 and 232:
Option III: “Agile America”: Ad
- Page 233 and 234:
Option III: “Agile America”: Ad
- Page 235:
Option III: “Agile America”: Ad
- Page 238 and 239:
204 Strategic Choices for a Turbule
- Page 240 and 241:
206 Strategic Choices for a Turbule
- Page 242 and 243:
208 Strategic Choices for a Turbule
- Page 244 and 245:
210 Strategic Choices for a Turbule
- Page 246 and 247:
212 Strategic Choices for a Turbule
- Page 248 and 249:
214 Strategic Choices for a Turbule
- Page 250 and 251:
216 Strategic Choices for a Turbule
- Page 252 and 253:
218 Strategic Choices for a Turbule
- Page 254 and 255:
220 Strategic Choices for a Turbule
- Page 256 and 257:
222 Strategic Choices for a Turbule
- Page 258 and 259:
224 Strategic Choices for a Turbule
- Page 261 and 262:
CODA The Challenge of Leadership: A
- Page 263:
The Challenge of Leadership: Aligni
- Page 266 and 267:
232 Strategic Choices for a Turbule
- Page 268 and 269:
234 Strategic Choices for a Turbule
- Page 270 and 271:
236 Strategic Choices for a Turbule
- Page 272 and 273:
238 Strategic Choices for a Turbule
- Page 274 and 275:
240 Strategic Choices for a Turbule
- Page 276 and 277:
242 Strategic Choices for a Turbule
- Page 278 and 279:
244 Strategic Choices for a Turbule
- Page 280 and 281:
246 Strategic Choices for a Turbule
- Page 282 and 283:
248 Strategic Choices for a Turbule
- Page 284 and 285:
250 Strategic Choices for a Turbule
- Page 286 and 287:
252 Strategic Choices for a Turbule
- Page 288 and 289:
254 Strategic Choices for a Turbule
- Page 290 and 291:
256 Strategic Choices for a Turbule
- Page 292 and 293:
258 Strategic Choices for a Turbule
- Page 294 and 295:
260 Strategic Choices for a Turbule
- Page 296 and 297:
262 Strategic Choices for a Turbule
- Page 298 and 299:
264 Strategic Choices for a Turbule
- Page 300 and 301:
266 Strategic Choices for a Turbule
- Page 302 and 303:
268 Strategic Choices for a Turbule
- Page 304 and 305:
270 Strategic Choices for a Turbule
- Page 306 and 307:
272 Strategic Choices for a Turbule
- Page 308 and 309:
274 Strategic Choices for a Turbule
- Page 310 and 311:
276 Strategic Choices for a Turbule