2018 Adopted Annual Operating & Capital Improvement Budget

You also want an ePaper? Increase the reach of your titles
YUMPU automatically turns print PDFs into web optimized ePapers that Google loves.
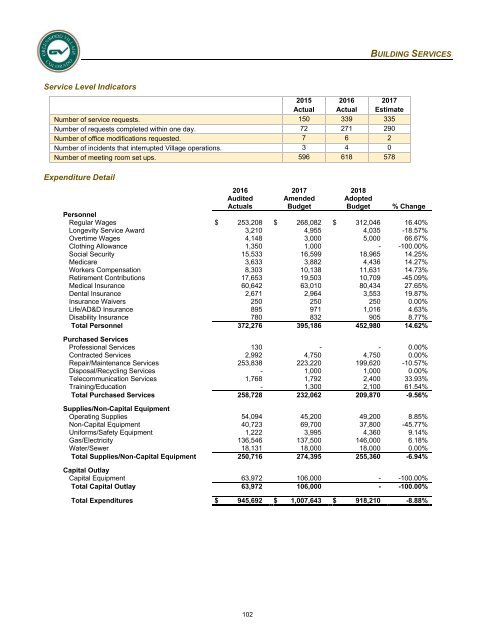
BUILDING SERVICES<br />
Service Level Indicators<br />
2015<br />
Actual<br />
2016<br />
Actual<br />
2017<br />
Estimate<br />
Number of service requests. 150 339 335<br />
Number of requests completed within one day. 72 271 290<br />
Number of office modifications requested. 7 6 2<br />
Number of incidents that interrupted Village operations. 3 4 0<br />
Number of meeting room set ups. 596 618 578<br />
Expenditure Detail<br />
2016<br />
Audited<br />
Actuals<br />
2017<br />
Amended<br />
<strong>Budget</strong><br />
<strong>2018</strong><br />
<strong>Adopted</strong><br />
<strong>Budget</strong><br />
% Change<br />
Personnel<br />
Regular Wages $ 253,208 $ 268,082 $ 312,046 16.40%<br />
Longevity Service Award 3,210 4,955 4,035 -18.57%<br />
Overtime Wages 4,148 3,000 5,000 66.67%<br />
Clothing Allowance 1,350 1,000 - -100.00%<br />
Social Security 15,533 16,599 18,965 14.25%<br />
Medicare 3,633 3,882 4,436 14.27%<br />
Workers Compensation 8,303 10,138 11,631 14.73%<br />
Retirement Contributions 17,653 19,503 10,709 -45.09%<br />
Medical Insurance 60,642 63,010 80,434 27.65%<br />
Dental Insurance 2,671 2,964 3,553 19.87%<br />
Insurance Waivers 250 250 250 0.00%<br />
Life/AD&D Insurance 895 971 1,016 4.63%<br />
Disability Insurance 780 832 905 8.77%<br />
Total Personnel 372,276 395,186 452,980 14.62%<br />
Purchased Services<br />
Professional Services 130 - - 0.00%<br />
Contracted Services 2,992 4,750 4,750 0.00%<br />
Repair/Maintenance Services 253,838 223,220 199,620 -10.57%<br />
Disposal/Recycling Services - 1,000 1,000 0.00%<br />
Telecommunication Services 1,768 1,792 2,400 33.93%<br />
Training/Education - 1,300 2,100 61.54%<br />
Total Purchased Services 258,728 232,062 209,870 -9.56%<br />
Supplies/Non-<strong>Capital</strong> Equipment<br />
<strong>Operating</strong> Supplies 54,094 45,200 49,200 8.85%<br />
Non-<strong>Capital</strong> Equipment 40,723 69,700 37,800 -45.77%<br />
Uniforms/Safety Equipment 1,222 3,995 4,360 9.14%<br />
Gas/Electricity 136,546 137,500 146,000 6.18%<br />
Water/Sewer 18,131 18,000 18,000 0.00%<br />
Total Supplies/Non-<strong>Capital</strong> Equipment 250,716 274,395 255,360 -6.94%<br />
<strong>Capital</strong> Outlay<br />
<strong>Capital</strong> Equipment 63,972 106,000 - -100.00%<br />
Total <strong>Capital</strong> Outlay 63,972 106,000 - -100.00%<br />
Total Expenditures $ 945,692 $ 1,007,643 $ 918,210 -8.88%<br />
102