2018 Adopted Annual Operating & Capital Improvement Budget

You also want an ePaper? Increase the reach of your titles
YUMPU automatically turns print PDFs into web optimized ePapers that Google loves.
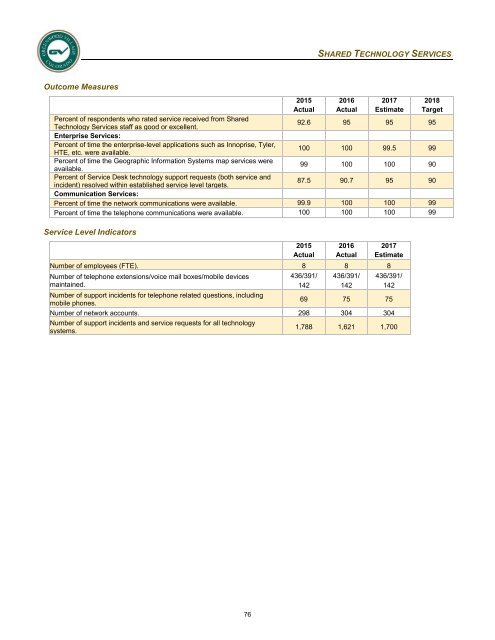
SHARED TECHNOLOGY SERVICES<br />
Outcome Measures<br />
2015<br />
Actual<br />
2016<br />
Actual<br />
2017<br />
Estimate<br />
Percent of respondents who rated service received from Shared<br />
Technology Services staff as good or excellent.<br />
92.6 95 95 95<br />
Enterprise Services:<br />
Percent of time the enterprise-level applications such as Innoprise, Tyler,<br />
HTE, etc. were available.<br />
100 100 99.5 99<br />
Percent of time the Geographic Information Systems map services were<br />
available.<br />
99 100 100 90<br />
Percent of Service Desk technology support requests (both service and<br />
incident) resolved within established service level targets.<br />
87.5 90.7 95 90<br />
Communication Services:<br />
Percent of time the network communications were available. 99.9 100 100 99<br />
Percent of time the telephone communications were available. 100 100 100 99<br />
Service Level Indicators<br />
2015<br />
Actual<br />
2016<br />
Actual<br />
2017<br />
Estimate<br />
Number of employees (FTE). 8 8 8<br />
Number of telephone extensions/voice mail boxes/mobile devices<br />
maintained.<br />
Number of support incidents for telephone related questions, including<br />
mobile phones.<br />
436/391/<br />
142<br />
436/391/<br />
142<br />
436/391/<br />
142<br />
69 75 75<br />
Number of network accounts. 298 304 304<br />
Number of support incidents and service requests for all technology<br />
systems.<br />
1,788 1,621 1,700<br />
<strong>2018</strong><br />
Target<br />
76