2018 Adopted Annual Operating & Capital Improvement Budget

You also want an ePaper? Increase the reach of your titles
YUMPU automatically turns print PDFs into web optimized ePapers that Google loves.
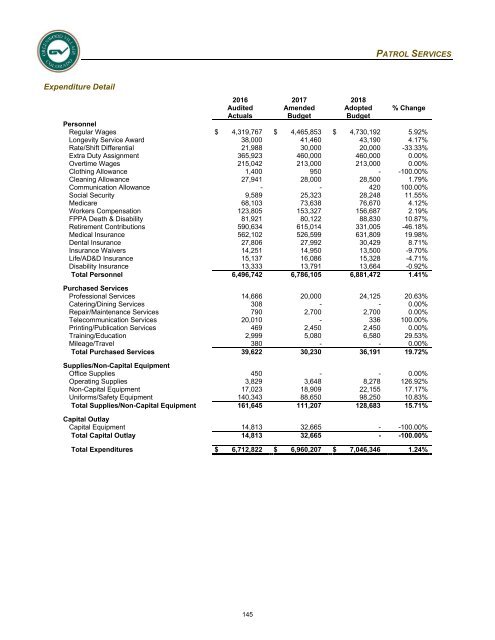
PATROL SERVICES<br />
Expenditure Detail<br />
2016<br />
Audited<br />
Actuals<br />
2017<br />
Amended<br />
<strong>Budget</strong><br />
<strong>2018</strong><br />
<strong>Adopted</strong><br />
<strong>Budget</strong><br />
% Change<br />
Personnel<br />
Regular Wages $ 4,319,767 $ 4,465,853 $ 4,730,192 5.92%<br />
Longevity Service Award 38,000 41,460 43,190 4.17%<br />
Rate/Shift Differential 21,988 30,000 20,000 -33.33%<br />
Extra Duty Assignment 365,923 460,000 460,000 0.00%<br />
Overtime Wages 215,042 213,000 213,000 0.00%<br />
Clothing Allowance 1,400 950 - -100.00%<br />
Cleaning Allowance 27,941 28,000 28,500 1.79%<br />
Communication Allowance - - 420 100.00%<br />
Social Security 9,589 25,323 28,248 11.55%<br />
Medicare 68,103 73,638 76,670 4.12%<br />
Workers Compensation 123,805 153,327 156,687 2.19%<br />
FPPA Death & Disability 81,921 80,122 88,830 10.87%<br />
Retirement Contributions 590,634 615,014 331,005 -46.18%<br />
Medical Insurance 562,102 526,599 631,809 19.98%<br />
Dental Insurance 27,806 27,992 30,429 8.71%<br />
Insurance Waivers 14,251 14,950 13,500 -9.70%<br />
Life/AD&D Insurance 15,137 16,086 15,328 -4.71%<br />
Disability Insurance 13,333 13,791 13,664 -0.92%<br />
Total Personnel 6,496,742 6,786,105 6,881,472 1.41%<br />
Purchased Services<br />
Professional Services 14,666 20,000 24,125 20.63%<br />
Catering/Dining Services 308 - - 0.00%<br />
Repair/Maintenance Services 790 2,700 2,700 0.00%<br />
Telecommunication Services 20,010 - 336 100.00%<br />
Printing/Publication Services 469 2,450 2,450 0.00%<br />
Training/Education 2,999 5,080 6,580 29.53%<br />
Mileage/Travel 380 - - 0.00%<br />
Total Purchased Services 39,622 30,230 36,191 19.72%<br />
Supplies/Non-<strong>Capital</strong> Equipment<br />
Office Supplies 450 - - 0.00%<br />
<strong>Operating</strong> Supplies 3,829 3,648 8,278 126.92%<br />
Non-<strong>Capital</strong> Equipment 17,023 18,909 22,155 17.17%<br />
Uniforms/Safety Equipment 140,343 88,650 98,250 10.83%<br />
Total Supplies/Non-<strong>Capital</strong> Equipment 161,645 111,207 128,683 15.71%<br />
<strong>Capital</strong> Outlay<br />
<strong>Capital</strong> Equipment 14,813 32,665 - -100.00%<br />
Total <strong>Capital</strong> Outlay 14,813 32,665 - -100.00%<br />
Total Expenditures $ 6,712,822 $ 6,960,207 $ 7,046,346 1.24%<br />
145