2018 Adopted Annual Operating & Capital Improvement Budget

Create successful ePaper yourself
Turn your PDF publications into a flip-book with our unique Google optimized e-Paper software.
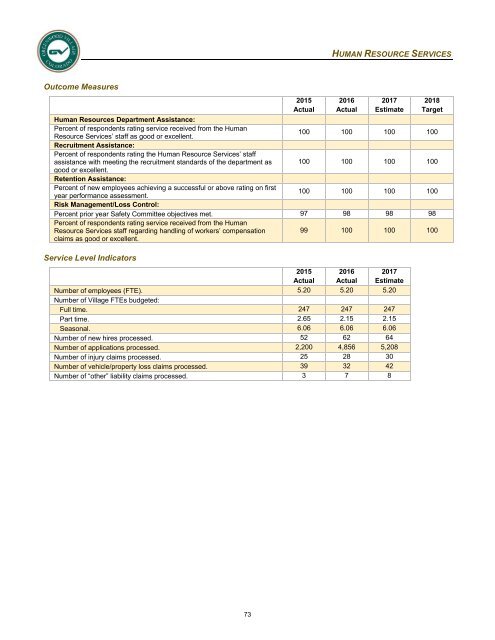
HUMAN RESOURCE SERVICES<br />
Outcome Measures<br />
2015<br />
Actual<br />
2016<br />
Actual<br />
2017<br />
Estimate<br />
<strong>2018</strong><br />
Target<br />
Human Resources Department Assistance:<br />
Percent of respondents rating service received from the Human<br />
Resource Services’ staff as good or excellent.<br />
100 100 100 100<br />
Recruitment Assistance:<br />
Percent of respondents rating the Human Resource Services’ staff<br />
assistance with meeting the recruitment standards of the department as 100 100 100 100<br />
good or excellent.<br />
Retention Assistance:<br />
Percent of new employees achieving a successful or above rating on first<br />
year performance assessment.<br />
100 100 100 100<br />
Risk Management/Loss Control:<br />
Percent prior year Safety Committee objectives met. 97 98 98 98<br />
Percent of respondents rating service received from the Human<br />
Resource Services staff regarding handling of workers’ compensation<br />
claims as good or excellent.<br />
99 100 100 100<br />
Service Level Indicators<br />
2015<br />
Actual<br />
2016<br />
Actual<br />
2017<br />
Estimate<br />
Number of employees (FTE). 5.20 5.20 5.20<br />
Number of Village FTEs budgeted:<br />
Full time. 247 247 247<br />
Part time. 2.65 2.15 2.15<br />
Seasonal. 6.06 6.06 6.06<br />
Number of new hires processed. 52 62 64<br />
Number of applications processed. 2,200 4,856 5,208<br />
Number of injury claims processed. 25 28 30<br />
Number of vehicle/property loss claims processed. 39 32 42<br />
Number of “other” liability claims processed. 3 7 8<br />
73