2018 Adopted Annual Operating & Capital Improvement Budget

You also want an ePaper? Increase the reach of your titles
YUMPU automatically turns print PDFs into web optimized ePapers that Google loves.
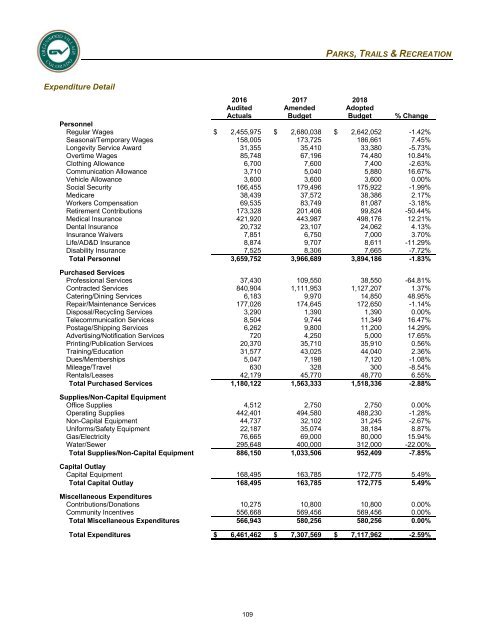
PARKS, TRAILS & RECREATION<br />
Expenditure Detail<br />
2016<br />
Audited<br />
Actuals<br />
2017<br />
Amended<br />
<strong>Budget</strong><br />
<strong>2018</strong><br />
<strong>Adopted</strong><br />
<strong>Budget</strong><br />
% Change<br />
Personnel<br />
Regular Wages $ 2,455,975 $ 2,680,038 $ 2,642,052 -1.42%<br />
Seasonal/Temporary Wages 158,005 173,725 186,661 7.45%<br />
Longevity Service Award 31,355 35,410 33,380 -5.73%<br />
Overtime Wages 85,748 67,196 74,480 10.84%<br />
Clothing Allowance 6,700 7,600 7,400 -2.63%<br />
Communication Allowance 3,710 5,040 5,880 16.67%<br />
Vehicle Allowance 3,600 3,600 3,600 0.00%<br />
Social Security 166,455 179,496 175,922 -1.99%<br />
Medicare 38,439 37,572 38,386 2.17%<br />
Workers Compensation 69,535 83,749 81,087 -3.18%<br />
Retirement Contributions 173,328 201,406 99,824 -50.44%<br />
Medical Insurance 421,920 443,987 498,176 12.21%<br />
Dental Insurance 20,732 23,107 24,062 4.13%<br />
Insurance Waivers 7,851 6,750 7,000 3.70%<br />
Life/AD&D Insurance 8,874 9,707 8,611 -11.29%<br />
Disability Insurance 7,525 8,306 7,665 -7.72%<br />
Total Personnel 3,659,752 3,966,689 3,894,186 -1.83%<br />
Purchased Services<br />
Professional Services 37,430 109,550 38,550 -64.81%<br />
Contracted Services 840,904 1,111,953 1,127,207 1.37%<br />
Catering/Dining Services 6,183 9,970 14,850 48.95%<br />
Repair/Maintenance Services 177,026 174,645 172,650 -1.14%<br />
Disposal/Recycling Services 3,290 1,390 1,390 0.00%<br />
Telecommunication Services 8,504 9,744 11,349 16.47%<br />
Postage/Shipping Services 6,262 9,800 11,200 14.29%<br />
Advertising/Notification Services 720 4,250 5,000 17.65%<br />
Printing/Publication Services 20,370 35,710 35,910 0.56%<br />
Training/Education 31,577 43,025 44,040 2.36%<br />
Dues/Memberships 5,047 7,198 7,120 -1.08%<br />
Mileage/Travel 630 328 300 -8.54%<br />
Rentals/Leases 42,179 45,770 48,770 6.55%<br />
Total Purchased Services 1,180,122 1,563,333 1,518,336 -2.88%<br />
Supplies/Non-<strong>Capital</strong> Equipment<br />
Office Supplies 4,512 2,750 2,750 0.00%<br />
<strong>Operating</strong> Supplies 442,401 494,580 488,230 -1.28%<br />
Non-<strong>Capital</strong> Equipment 44,737 32,102 31,245 -2.67%<br />
Uniforms/Safety Equipment 22,187 35,074 38,184 8.87%<br />
Gas/Electricity 76,665 69,000 80,000 15.94%<br />
Water/Sewer 295,648 400,000 312,000 -22.00%<br />
Total Supplies/Non-<strong>Capital</strong> Equipment 886,150 1,033,506 952,409 -7.85%<br />
<strong>Capital</strong> Outlay<br />
<strong>Capital</strong> Equipment 168,495 163,785 172,775 5.49%<br />
Total <strong>Capital</strong> Outlay 168,495 163,785 172,775 5.49%<br />
Miscellaneous Expenditures<br />
Contributions/Donations 10,275 10,800 10,800 0.00%<br />
Community Incentives 556,668 569,456 569,456 0.00%<br />
Total Miscellaneous Expenditures 566,943 580,256 580,256 0.00%<br />
Total Expenditures $ 6,461,462 $ 7,307,569 $ 7,117,962 -2.59%<br />
109