- Page 1:
2018 Annual Operating & Capital Imp
- Page 4 and 5:
TABLE OF CONTENTS Appendix Long-Ran
- Page 6 and 7:
DISTINGUISHED BUDGET PRESENTATION A
- Page 8 and 9:
GOVERNMENT PROFILE Organizational C
- Page 10 and 11:
GOVERNMENT PROFILE Organizational P
- Page 12 and 13:
GOVERNMENT PROFILE supports ongoing
- Page 14 and 15:
COMMUNITY PROFILE Transportation As
- Page 16 and 17:
COMMUNITY PROFILE Economic Developm
- Page 18 and 19:
ECONOMIC INDICATORS Consumer Confid
- Page 20 and 21:
BUDGET PROCESS Budget Calendar Janu
- Page 22 and 23:
BUDGET PROCESS Debt Service Funds a
- Page 24 and 25:
REVENUE ASSESSMENT Taxes & Special
- Page 26 and 27:
REVENUE ASSESSMENT discussions with
- Page 28 and 29:
REVENUE ASSESSMENT and park use. Re
- Page 30 and 31:
REVENUE ASSESSMENT Miscellaneous Re
- Page 32 and 33:
EXPENDITURE ASSESSMENT Personnel Pe
- Page 34 and 35:
EXPENDITURE ASSESSMENT Capital Outl
- Page 36 and 37:
OTHER SOURCES & USES Overview Since
- Page 38 and 39:
FUND BALANCE ANALYSIS 2018 Beginnin
- Page 40 and 41:
CITY-WIDE REVENUE DETAIL 2016 Audit
- Page 42 and 43:
CITY-WIDE EXPENDITURE DETAIL 2016 A
- Page 44 and 45:
FUND/DEPARTMENT APPROPRIATIONS Appr
- Page 46 and 47:
GENERAL FUND FINANCIAL SUMMARY Reve
- Page 48 and 49:
GENERAL FUND REVENUE DETAIL 2016 Au
- Page 50 and 51:
GENERAL FUND EXPENDITURE DETAIL 201
- Page 52 and 53:
MAYOR & COUNCIL Expenditure Detail
- Page 54 and 55:
CITY MANAGEMENT Personnel & Financi
- Page 56 and 57:
CITY MANAGER’S OFFICE Statement o
- Page 58 and 59:
COMMUNITY OUTREACH Statement of Pur
- Page 60 and 61:
COMMUNITY OUTREACH Expenditure Deta
- Page 62 and 63:
CITY ATTORNEY Personnel & Financial
- Page 64 and 65:
60
- Page 66 and 67:
MUNICIPAL JUDGE Expenditure Detail
- Page 68 and 69:
ADMINISTRATIVE SERVICES Personnel &
- Page 70 and 71:
ADMINISTRATION Statement of Purpose
- Page 72 and 73:
INFORMATION MANAGEMENT SERVICES Sta
- Page 74 and 75:
MUNICIPAL COURT SERVICES Statement
- Page 76 and 77:
HUMAN RESOURCE SERVICES Statement o
- Page 78 and 79:
HUMAN RESOURCE SERVICES Expenditure
- Page 80 and 81:
SHARED TECHNOLOGY SERVICES Outcome
- Page 82 and 83:
SHARED TECHNOLOGY SERVICES Variance
- Page 84 and 85:
FINANCE Personnel & Financial Summa
- Page 86 and 87:
ADMINISTRATION Statement of Purpose
- Page 88 and 89:
ACCOUNTING & FINANCIAL REPORTING St
- Page 90 and 91:
ACCOUNTING & FINANCIAL REPORTING Va
- Page 92 and 93:
TAXPAYER SERVICES Expenditure Detai
- Page 94 and 95:
COMMUNITY DEVELOPMENT Personnel & F
- Page 96 and 97:
ADMINISTRATION Statement of Purpose
- Page 98 and 99:
PLANNING Statement of Purpose The P
- Page 100 and 101:
BUILDING SAFETY Statement of Purpos
- Page 102 and 103:
NEIGHBORHOOD SERVICES Statement of
- Page 104 and 105:
NEIGHBORHOOD SERVICES Expenditure D
- Page 106 and 107:
BUILDING SERVICES Service Level Ind
- Page 108 and 109:
104
- Page 110 and 111:
PARKS, TRAILS & RECREATION Organiza
- Page 112 and 113:
PARKS, TRAILS & RECREATION Explanat
- Page 114 and 115:
ADMINISTRATION Statement of Purpose
- Page 116 and 117: RECREATION Statement of Purpose The
- Page 118 and 119: RECREATION Expenditure Detail 2016
- Page 120 and 121: CULTURAL ARTS Statement of Purpose
- Page 122 and 123: CULTURAL ARTS Service Level Indicat
- Page 124 and 125: CULTURAL ARTS Variance Justificatio
- Page 126 and 127: PARKS, TRAILS & OPEN SPACE Expendit
- Page 128 and 129: PARKS & TRAILS MAINTENANCE Expendit
- Page 130 and 131: PARKS & TRAILS MAINTENANCE Expendit
- Page 132 and 133: PARKS & TRAILS MAINTENANCE Expendit
- Page 134 and 135: PARKS & TRAILS MAINTENANCE Expendit
- Page 136 and 137: POLICE Organizational Chart Chief o
- Page 138 and 139: POLICE Explanation of Budget Varian
- Page 140 and 141: ADMINISTRATION Statement of Purpose
- Page 142 and 143: ADMINISTRATION Variance Justificati
- Page 144 and 145: SUPPORT SERVICES Outcome Measures 9
- Page 146 and 147: SUPPORT SERVICES Variance Justifica
- Page 148 and 149: PATROL SERVICES Outcome Measures 20
- Page 150 and 151: PATROL SERVICES Variance Justificat
- Page 152 and 153: DETECTIVE SERVICES Expenditure Deta
- Page 154 and 155: 150
- Page 156 and 157: PUBLIC WORKS Organizational Chart D
- Page 158 and 159: PUBLIC WORKS Expenditure Detail 201
- Page 160 and 161: ADMINISTRATION Expenditure Detail 2
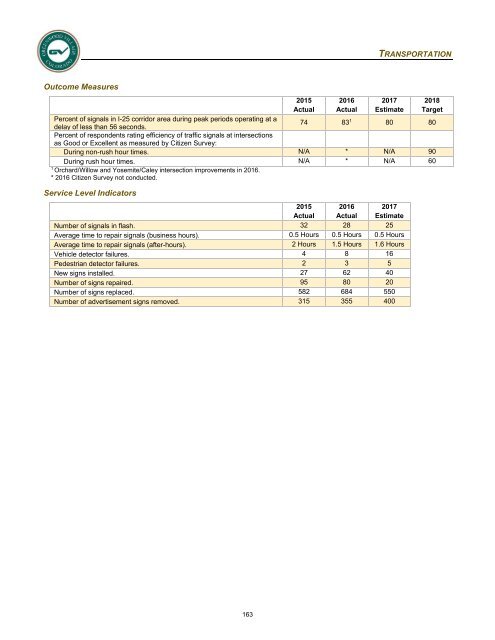
- Page 162 and 163: ENVIRONMENTAL SERVICES Statement of
- Page 164 and 165: ENVIRONMENTAL SERVICES Expenditure
- Page 168 and 169: TRANSPORTATION Expenditure Detail 2
- Page 170 and 171: SNOW & ICE CONTROL Statement of Pur
- Page 172 and 173: ROADS Statement of Purpose The Road
- Page 174 and 175: ROADS Variance Justification Perso
- Page 176 and 177: FLEET MANAGEMENT Service Level Indi
- Page 178 and 179: 174
- Page 180 and 181: 176
- Page 182 and 183: CAPITAL PROJECTS FUND FINANCIAL SUM
- Page 184 and 185: CAPITAL PROJECTS FUND EXPENDITURE D
- Page 186: FIVE-YEAR CAPITAL PROJECT SUMMARY 2
- Page 190 and 191: 184 PROJECT DETAILS
- Page 192 and 193: 186 PROJECT DETAILS
- Page 194 and 195: 188 PROJECT DETAILS
- Page 196 and 197: 190 PROJECT DETAILS
- Page 198 and 199: 192 PROJECT DETAILS
- Page 200 and 201: 194 PROJECT DETAILS
- Page 202 and 203: 196 PROJECT DETAILS
- Page 204 and 205: 198 PROJECT DETAILS
- Page 206 and 207: 200 PROJECT DETAILS
- Page 208 and 209: 202 PROJECT DETAILS
- Page 210 and 211: 204 PROJECT DETAILS
- Page 212 and 213: 206 PROJECT DETAILS
- Page 214 and 215: 208 PROJECT DETAILS
- Page 216 and 217:
210 PROJECT DETAILS
- Page 218 and 219:
212 PROJECT DETAILS
- Page 220 and 221:
214 PROJECT DETAILS
- Page 222 and 223:
216 PROJECT DETAILS
- Page 224 and 225:
218 PROJECT DETAILS
- Page 226 and 227:
220 PROJECT DETAILS
- Page 228 and 229:
222 PROJECT DETAILS
- Page 230 and 231:
224 PROJECT DETAILS
- Page 232 and 233:
226 PROJECT DETAILS
- Page 234 and 235:
228 PROJECT DETAILS
- Page 236 and 237:
230 PROJECT DETAILS
- Page 238 and 239:
232 PROJECT DETAILS
- Page 240 and 241:
234 PROJECT DETAILS
- Page 242 and 243:
236 PROJECT DETAILS
- Page 244:
GENERAL FUND LONG-RANGE FINANCIAL P
- Page 248 and 249:
PERSONNEL SUMMARY Full-Time Equival
- Page 250 and 251:
PERSONNEL SUMMARY 2016 Audited Actu
- Page 252 and 253:
FINANCIAL POLICIES Procurement Poli
- Page 254 and 255:
GLOSSARY OF TERMS Acronyms CAFR: CI
- Page 256 and 257:
GLOSSARY OF TERMS Contractual Servi
- Page 258 and 259:
GLOSSARY OF TERMS Service Level Sou
- Page 260 and 261:
252
- Page 262:
254