In Fonderia 1 2024
Primo numero del 2024 di In Fonderia
Primo numero del 2024 di In Fonderia

You also want an ePaper? Increase the reach of your titles
YUMPU automatically turns print PDFs into web optimized ePapers that Google loves.
TECNICO<br />
535°C x 120 min 535°C x 240 min 535°C x 360 min<br />
Media/Average 94.6 95.8 98.8<br />
Dev. Sandard/Standard dev. 3.4 2.9 2.6<br />
Tab. 4 - Valori di durezza HBW2,5/62,5 della lega trattata secondo i processi di solubilizzazione descritti.<br />
Tab. 4 - HBW2.5/62.5 hardness values of the alloy treated according to the solubilisation processes described.<br />
fenomeni di diffusione nella lega che avvengono<br />
nei primi 30 minuti di solubilizzazione. Per<br />
quanto riguarda l’allungamento percentuale<br />
a rottura, è possibile notare come il valore più<br />
alto sia stato ottenuto nei provini di trazione<br />
ricavati da getti solubilizzati per 240 min. <strong>In</strong><br />
Tab. 4 sono invece riportati i risultati delle prove<br />
di durezza Brinell HBW2,5/62,5 eseguite<br />
sugli stessi campioni.<br />
Tenendo conto delle deviazioni standard, è<br />
stato possibile constatare che anche la durezza<br />
non è variata in maniera all’aumentare della<br />
durata del trattamento di solubilizzazione,<br />
pur mostrando un trend crescente dei valori<br />
medi al crescere del tempo di solubilizzazione<br />
in analogia alle caratteristiche meccaniche.<br />
A valle delle prove di trazione, si è proceduto<br />
inoltre con un controllo della microstruttura.<br />
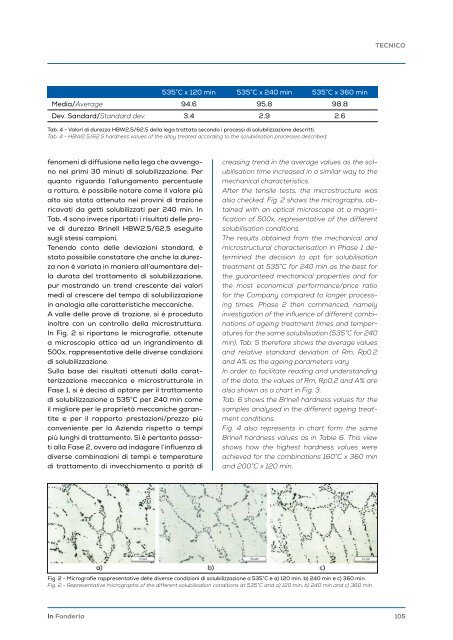
<strong>In</strong> Fig. 2 si riportano le micrografie, ottenute<br />
a microscopio ottico ad un ingrandimento di<br />
500x, rappresentative delle diverse condizioni<br />
di solubilizzazione.<br />
Sulla base dei risultati ottenuti dalla caratterizzazione<br />
meccanica e microstrutturale in<br />
Fase 1, si è deciso di optare per il trattamento<br />
di solubilizzazione a 535°C per 240 min come<br />
il migliore per le proprietà meccaniche garantite<br />
e per il rapporto prestazioni/prezzo più<br />
conveniente per la Azienda rispetto a tempi<br />
più lunghi di trattamento. Si è pertanto passati<br />
alla Fase 2, ovvero ad indagare l’influenza di<br />
diverse combinazioni di tempi e temperature<br />
di trattamento di invecchiamento a parità di<br />
creasing trend in the average values as the solubilisation<br />
time increased in a similar way to the<br />
mechanical characteristics.<br />
After the tensile tests, the microstructure was<br />
also checked. Fig. 2 shows the micrographs, obtained<br />
with an optical microscope at a magnification<br />
of 500x, representative of the different<br />
solubilisation conditions.<br />
The results obtained from the mechanical and<br />
microstructural characterisation in Phase 1 determined<br />
the decision to opt for solubilisation<br />
treatment at 535°C for 240 min as the best for<br />
the guaranteed mechanical properties and for<br />
the most economical performance/price ratio<br />
for the Company compared to longer processing<br />
times. Phase 2 then commenced, namely<br />
investigation of the influence of different combinations<br />
of ageing treatment times and temperatures<br />
for the same solubilisation (535°C for 240<br />
min). Tab. 5 therefore shows the average values <br />
and relative standard deviation of Rm, Rp0.2<br />
and A% as the ageing parameters vary<br />
<strong>In</strong> order to facilitate reading and understanding<br />
of the data, the values of Rm, Rp0.2 and A% are<br />
also shown as a chart in Fig. 3.<br />
Tab. 6 shows the Brinell hardness values for the<br />
samples analysed in the different ageing treatment<br />
conditions.<br />
Fig. 4 also represents in chart form the same<br />
Brinell hardness values as in Table 6. This view<br />
shows how the highest hardness values were<br />
achieved for the combinations 160°C x 360 min<br />
and 200°C x 120 min.<br />
Fig. 2 - Micrografie rappresentative delle diverse condizioni di solubilizzazione a 535°C e a) 120 min, b) 240 min e c) 360 min.<br />
Fig. 2 - Representative micrographs of the different solubilisation conditions at 535°C and a) 120 min, b) 240 min and c) 360 min.<br />
<strong>In</strong> <strong>Fonderia</strong><br />
105