Heiss W.D. (ed.) Quantum dots.. a doorway to - tiera.ru
Heiss W.D. (ed.) Quantum dots.. a doorway to - tiera.ru
Heiss W.D. (ed.) Quantum dots.. a doorway to - tiera.ru

Create successful ePaper yourself
Turn your PDF publications into a flip-book with our unique Google optimized e-Paper software.
54 J.M. Elzerman et al.<br />
V L (V)<br />
-1.1<br />
-1.0<br />
a b<br />
00<br />
-0.9<br />
0.0 -0.2 -0.4 -0.6<br />
V PR (V)<br />
-1.02<br />
-1.00<br />
-0.98<br />
-0.96<br />
12<br />
22<br />
01<br />
11<br />
21<br />
00<br />
10<br />
-0.15 -0.20 -0.25 -0.30<br />
V PR (V)<br />
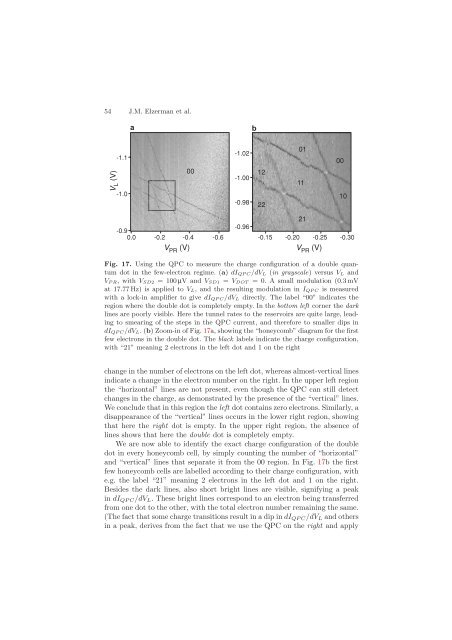
Fig. 17. Using the QPC <strong>to</strong> measure the charge configuration of a double quantum<br />
dot in the few-electron regime. (a) dIQP C/dVL (in grayscale) versusVL and<br />
VPR,withVSD2 = 100 µV andVSD1 = VDOT = 0. A small modulation (0.3 mV<br />
at 17.77 Hz) is appli<strong>ed</strong> <strong>to</strong> VL, and the resulting modulation in IQP C is measur<strong>ed</strong><br />
with a lock-in amplifier <strong>to</strong> give dIQP C/dVL directly. The label “00” indicates the<br />
region where the double dot is completely empty. In the bot<strong>to</strong>m left corner the dark<br />
lines are poorly visible. Here the tunnel rates <strong>to</strong> the reservoirs are quite large, leading<br />
<strong>to</strong> smearing of the steps in the QPC current, and therefore <strong>to</strong> smaller dips in<br />
dIQP C/dVL. (b) Zoom-in of Fig. 17a, showing the “honeycomb” diagram for the first<br />
few electrons in the double dot. The black labels indicate the charge configuration,<br />
with “21” meaning 2 electrons in the left dot and 1 on the right<br />
change in the number of electrons on the left dot, whereas almost-vertical lines<br />
indicate a change in the electron number on the right. In the upper left region<br />
the “horizontal” lines are not present, even though the QPC can still detect<br />
changes in the charge, as demonstrat<strong>ed</strong> by the presence of the “vertical” lines.<br />
We conclude that in this region the left dot contains zero electrons. Similarly, a<br />
disappearance of the “vertical” lines occurs in the lower right region, showing<br />
that here the right dot is empty. In the upper right region, the absence of<br />
lines shows that here the double dot is completely empty.<br />
We are now able <strong>to</strong> identify the exact charge configuration of the double<br />
dot in every honeycomb cell, by simply counting the number of “horizontal”<br />
and “vertical” lines that separate it from the 00 region. In Fig. 17b the first<br />
few honeycomb cells are labell<strong>ed</strong> according <strong>to</strong> their charge configuration, with<br />
e.g. the label “21” meaning 2 electrons in the left dot and 1 on the right.<br />
Besides the dark lines, also short bright lines are visible, signifying a peak<br />
in dIQP C/dVL. These bright lines correspond <strong>to</strong> an electron being transferr<strong>ed</strong><br />
from one dot <strong>to</strong> the other, with the <strong>to</strong>tal electron number remaining the same.<br />
(The fact that some charge transitions result in a dip in dIQP C/dVL and others<br />
in a peak, derives from the fact that we use the QPC on the right and apply