Heiss W.D. (ed.) Quantum dots.. a doorway to - tiera.ru
Heiss W.D. (ed.) Quantum dots.. a doorway to - tiera.ru
Heiss W.D. (ed.) Quantum dots.. a doorway to - tiera.ru

You also want an ePaper? Increase the reach of your titles
YUMPU automatically turns print PDFs into web optimized ePapers that Google loves.
70 J.M. Elzerman et al.<br />
∆I (nA)<br />
3<br />
2<br />
1<br />
0<br />
a<br />
0 1 2 3 4<br />
Time (ms)<br />
2<br />
1<br />
0<br />
b<br />
0 1 2 3 4<br />
Time (ms)<br />
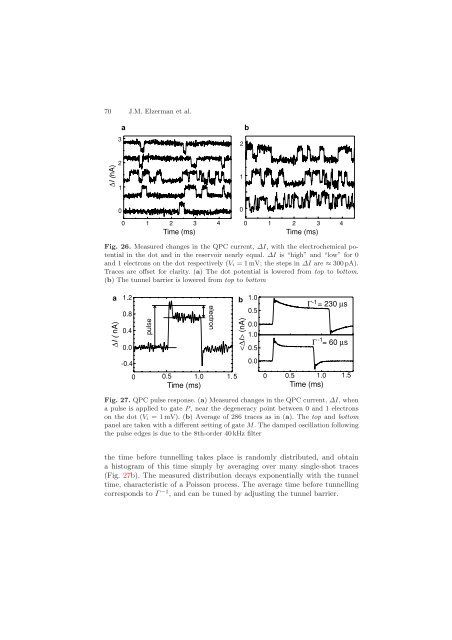
Fig. 26. Measur<strong>ed</strong> changes in the QPC current, ∆I, with the electrochemical potential<br />
in the dot and in the reservoir nearly equal. ∆I is “high” and “low” for 0<br />
and 1 electrons on the dot respectively (Vi =1mV;thestepsin∆I are ≈ 300 pA).<br />
Traces are offset for clarity. (a) The dot potential is lower<strong>ed</strong> from <strong>to</strong>p <strong>to</strong> bot<strong>to</strong>m.<br />
(b) The tunnel barrier is lower<strong>ed</strong> from <strong>to</strong>p <strong>to</strong> bot<strong>to</strong>m<br />
a<br />
∆I (nA)<br />
1.2<br />
0.8<br />
0.4<br />
0.0<br />
-0.4<br />
pulse<br />
0 0.5 1.0<br />
Time (ms)<br />
electron<br />
1.5<br />
b<br />
(nA)<br />
1.0<br />
0.5<br />
0.0<br />
1.0<br />
0.5<br />
0.0<br />
Γ -1=<br />
230 µ s<br />
-1<br />
Γ =60µ s<br />
0 0.5 1.0 1.5<br />
Time (ms)<br />
Fig. 27. QPC pulse response. (a) Measur<strong>ed</strong> changes in the QPC current, ∆I, when<br />
a pulse is appli<strong>ed</strong> <strong>to</strong> gate P , near the degeneracy point between 0 and 1 electrons<br />
on the dot (Vi = 1 mV). (b) Averageof286tracesasin(a). The <strong>to</strong>p and bot<strong>to</strong>m<br />
panel are taken with a different setting of gate M. The damp<strong>ed</strong> oscillation following<br />
the pulse <strong>ed</strong>ges is due <strong>to</strong> the 8th-order 40 kHz filter<br />
the time before tunnelling takes place is randomly distribut<strong>ed</strong>, and obtain<br />
a his<strong>to</strong>gram of this time simply by averaging over many single-shot traces<br />
(Fig. 27b). The measur<strong>ed</strong> distribution decays exponentially with the tunnel<br />
time, characteristic of a Poisson process. The average time before tunnelling<br />
corresponds <strong>to</strong> Γ −1 , and can be tun<strong>ed</strong> by adjusting the tunnel barrier.