Heiss W.D. (ed.) Quantum dots.. a doorway to - tiera.ru
Heiss W.D. (ed.) Quantum dots.. a doorway to - tiera.ru
Heiss W.D. (ed.) Quantum dots.. a doorway to - tiera.ru

Create successful ePaper yourself
Turn your PDF publications into a flip-book with our unique Google optimized e-Paper software.
62 J.M. Elzerman et al.<br />
lock-in signal (arb. units)<br />
-0.96<br />
τ = 15 µs<br />
a<br />
100<br />
-0.96 0<br />
1<br />
b<br />
45<br />
2<br />
90<br />
3<br />
4<br />
180<br />
5<br />
6<br />
300<br />
N =1<br />
-1.12<br />
0<br />
0 τ (µs) 370<br />
N =0<br />
V -1.13<br />
M (V)<br />
-0.76<br />
7<br />
8<br />
f = 4.17 kHz 7 6 5 4<br />
2<br />
3<br />
-0.76<br />
3<br />
4<br />
5<br />
6<br />
7<br />
8<br />
f = 41.7 kHz 7 6 5 4<br />
2<br />
3<br />
-1.07 VM (V) -1.40<br />
V R (V)<br />
0<br />
1<br />
2<br />
c<br />
dip height (%)<br />
V R (V)<br />
-0.96<br />
0<br />
1<br />
2<br />
-0.76<br />
3<br />
4<br />
5<br />
6<br />
7<br />
8<br />
f = 41.7 Hz 7 6 5 4<br />
2<br />
3<br />
-1.07 VM (V) -1.40<br />
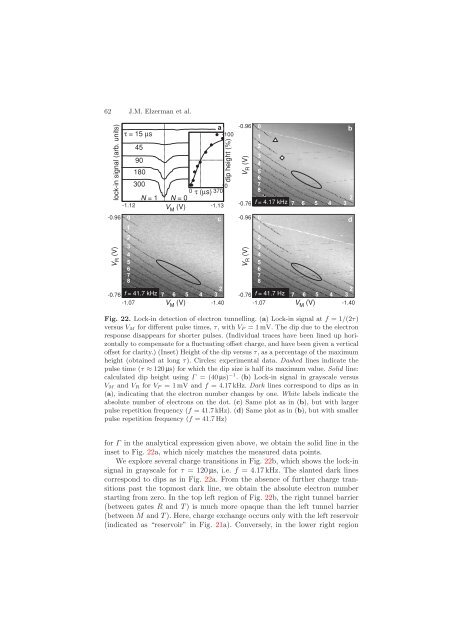
Fig. 22. Lock-in detection of electron tunnelling. (a) Lock-in signal at f =1/(2τ)<br />
versus VM for different pulse times, τ, withVP = 1 mV. The dip due <strong>to</strong> the electron<br />
response disappears for shorter pulses. (Individual traces have been lin<strong>ed</strong> up horizontally<br />
<strong>to</strong> compensate for a fluctuating offset charge, and have been given a vertical<br />
offset for clarity.) (Inset) Height of the dip versus τ, as a percentage of the maximum<br />
height (obtain<strong>ed</strong> at long τ). Circles: experimental data. Dash<strong>ed</strong> lines indicate the<br />
pulse time (τ ≈ 120 µs) for which the dip size is half its maximum value. Solid line:<br />
calculat<strong>ed</strong> dip height using Γ =(40µs) −1 .(b) Lock-in signal in grayscale versus<br />
VM and VR for VP =1mVandf =4.17 kHz. Dark lines correspond <strong>to</strong> dips as in<br />
(a), indicating that the electron number changes by one. White labels indicate the<br />
absolute number of electrons on the dot. (c) Sameplotasin(b), but with larger<br />
pulse repetition frequency (f =41.7kHz). (d) Sameplotasin(b), but with smaller<br />
pulse repetition frequency (f =41.7Hz)<br />
for Γ in the analytical expression given above, we obtain the solid line in the<br />
inset <strong>to</strong> Fig. 22a, which nicely matches the measur<strong>ed</strong> data points.<br />
We explore several charge transitions in Fig. 22b, which shows the lock-in<br />
signal in grayscale for τ = 120 µs, i.e. f =4.17 kHz. The slant<strong>ed</strong> dark lines<br />
correspond <strong>to</strong> dips as in Fig. 22a. From the absence of further charge transitions<br />
past the <strong>to</strong>pmost dark line, we obtain the absolute electron number<br />
starting from zero. In the <strong>to</strong>p left region of Fig. 22b, the right tunnel barrier<br />
(between gates R and T ) is much more opaque than the left tunnel barrier<br />
(between M and T ). Here, charge exchange occurs only with the left reservoir<br />
(indicat<strong>ed</strong> as “reservoir” in Fig. 21a). Conversely, in the lower right region<br />
V R (V)<br />
d