Heiss W.D. (ed.) Quantum dots.. a doorway to - tiera.ru
Heiss W.D. (ed.) Quantum dots.. a doorway to - tiera.ru
Heiss W.D. (ed.) Quantum dots.. a doorway to - tiera.ru

Create successful ePaper yourself
Turn your PDF publications into a flip-book with our unique Google optimized e-Paper software.
76 J.M. Elzerman et al.<br />
-1.12<br />
V M (V)<br />
-1.13<br />
a<br />
∆I QPC (nA)<br />
0 2<br />
t wait<br />
t read<br />
0.0 0.5<br />
Time (ms)<br />
1.0<br />
∆E Z<br />
∆I QPC (nA)<br />
∆I QPC (nA)<br />
∆I QPC (nA)<br />
∆I QPC (nA)<br />
2<br />
1<br />
0<br />
2<br />
1<br />
0<br />
2<br />
1<br />
0<br />
2<br />
1<br />
0<br />
b<br />
0 1<br />
Time (ms)<br />
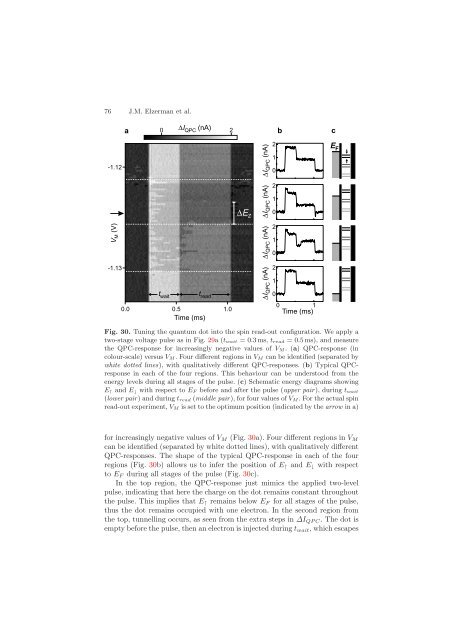
Fig. 30. Tuning the quantum dot in<strong>to</strong> the spin read-out configuration. We apply a<br />
two-stage voltage pulse as in Fig. 29a (twait =0.3ms,tread = 0.5 ms), and measure<br />
the QPC-response for increasingly negative values of VM .(a) QPC-response(in<br />
colour-scale) versus VM . Four different regions in VM can be identifi<strong>ed</strong> (separat<strong>ed</strong> by<br />
white dott<strong>ed</strong> lines), with qualitatively different QPC-responses. (b) Typical QPCresponse<br />
in each of the four regions. This behaviour can be unders<strong>to</strong>od from the<br />
energy levels during all stages of the pulse. (c) Schematic energy diagrams showing<br />
E↑ and E↓ with respect <strong>to</strong> EF before and after the pulse (upper pair), during twait<br />
(lower pair) and during tread (middle pair), for four values of VM .Fortheactualspin<br />
read-out experiment, VM is set <strong>to</strong> the optimum position (indicat<strong>ed</strong> by the arrow in a)<br />
for increasingly negative values of VM (Fig. 30a). Four different regions in VM<br />
can be identifi<strong>ed</strong> (separat<strong>ed</strong> by white dott<strong>ed</strong> lines), with qualitatively different<br />
QPC-responses. The shape of the typical QPC-response in each of the four<br />
regions (Fig. 30b) allows us <strong>to</strong> infer the position of E↑ and E↓ with respect<br />
<strong>to</strong> EF during all stages of the pulse (Fig. 30c).<br />
In the <strong>to</strong>p region, the QPC-response just mimics the appli<strong>ed</strong> two-level<br />
pulse, indicating that here the charge on the dot remains constant throughout<br />
the pulse. This implies that E↑ remains below EF for all stages of the pulse,<br />
thus the dot remains occupi<strong>ed</strong> with one electron. In the second region from<br />
the <strong>to</strong>p, tunnelling occurs, as seen from the extra steps in ∆IQP C. The dot is<br />
empty before the pulse, then an electron is inject<strong>ed</strong> during twait, which escapes<br />
c<br />
E F