Heiss W.D. (ed.) Quantum dots.. a doorway to - tiera.ru
Heiss W.D. (ed.) Quantum dots.. a doorway to - tiera.ru
Heiss W.D. (ed.) Quantum dots.. a doorway to - tiera.ru

You also want an ePaper? Increase the reach of your titles
YUMPU automatically turns print PDFs into web optimized ePapers that Google loves.
64 J.M. Elzerman et al.<br />
lock-in signal<br />
(arb. units)<br />
b<br />
E F<br />
a<br />
c<br />
B // =10T<br />
-1.135 VM (V) -1.150<br />
ES<br />
Γ<br />
GS<br />
b<br />
N =1 N =0<br />
10<br />
V P (mV)<br />
1 f = 385 Hz<br />
-1.13 -1.15<br />
c<br />
N =1<br />
Γ eff<br />
V M (V)<br />
∆E Z<br />
d<br />
N =0<br />
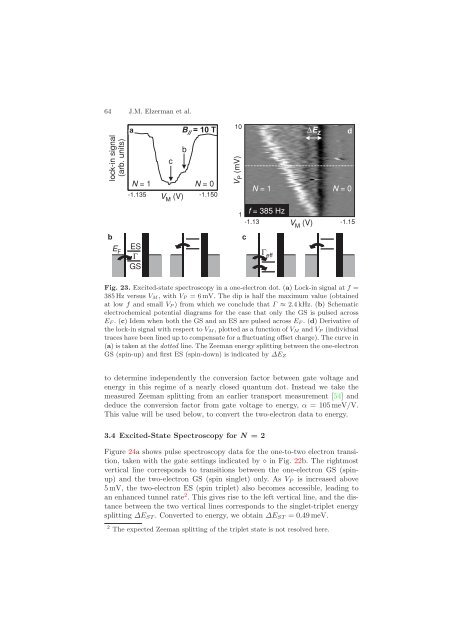
Fig. 23. Excit<strong>ed</strong>-state spectroscopy in a one-electron dot. (a) Lock-in signal at f =<br />
385 Hz versus VM ,withVP = 6 mV. The dip is half the maximum value (obtain<strong>ed</strong><br />
at low f and small VP ) from which we conclude that Γ ≈ 2.4kHz. (b) Schematic<br />
electrochemical potential diagrams for the case that only the GS is puls<strong>ed</strong> across<br />
EF .(c) IdemwhenboththeGSandanESarepuls<strong>ed</strong>acrossEF .(d) Derivative of<br />
the lock-in signal with respect <strong>to</strong> VM , plott<strong>ed</strong> as a function of VM and VP (individual<br />
traces have been lin<strong>ed</strong> up <strong>to</strong> compensate for a fluctuating offset charge). The curve in<br />
(a) is taken at the dott<strong>ed</strong> line. The Zeeman energy splitting between the one-electron<br />
GS (spin-up) and first ES (spin-down) is indicat<strong>ed</strong> by ∆EZ<br />
<strong>to</strong> determine independently the conversion fac<strong>to</strong>r between gate voltage and<br />
energy in this regime of a nearly clos<strong>ed</strong> quantum dot. Instead we take the<br />
measur<strong>ed</strong> Zeeman splitting from an earlier transport measurement [54] and<br />
d<strong>ed</strong>uce the conversion fac<strong>to</strong>r from gate voltage <strong>to</strong> energy, α = 105 meV/V.<br />
This value will be us<strong>ed</strong> below, <strong>to</strong> convert the two-electron data <strong>to</strong> energy.<br />
3.4 Excit<strong>ed</strong>-State Spectroscopy for N =2<br />
Figure 24a shows pulse spectroscopy data for the one-<strong>to</strong>-two electron transition,<br />
taken with the gate settings indicat<strong>ed</strong> by ⋄ in Fig. 22b. The rightmost<br />
vertical line corresponds <strong>to</strong> transitions between the one-electron GS (spinup)<br />
and the two-electron GS (spin singlet) only. As VP is increas<strong>ed</strong> above<br />
5 mV, the two-electron ES (spin triplet) also becomes accessible, leading <strong>to</strong><br />
an enhanc<strong>ed</strong> tunnel rate 2 . This gives rise <strong>to</strong> the left vertical line, and the distance<br />
between the two vertical lines corresponds <strong>to</strong> the singlet-triplet energy<br />
splitting ∆EST. Convert<strong>ed</strong> <strong>to</strong> energy, we obtain ∆EST =0.49 meV.<br />
2 The expect<strong>ed</strong> Zeeman splitting of the triplet state is not resolv<strong>ed</strong> here.