Heiss W.D. (ed.) Quantum dots.. a doorway to - tiera.ru
Heiss W.D. (ed.) Quantum dots.. a doorway to - tiera.ru
Heiss W.D. (ed.) Quantum dots.. a doorway to - tiera.ru

Create successful ePaper yourself
Turn your PDF publications into a flip-book with our unique Google optimized e-Paper software.
Semiconduc<strong>to</strong>r Few-Electron <strong>Quantum</strong> Dots as Spin Qubits 65<br />
10 ∆E ST<br />
V P (mV)<br />
c<br />
1<br />
E F<br />
N =2 N =1 N =2<br />
N =1<br />
f = 385 Hz<br />
-1.160 V -1.175<br />
M (V)<br />
↔S<br />
↔S<br />
Γ<br />
a b<br />
f = 1.538 kHz<br />
-1.160 V -1.175<br />
M (V)<br />
d Γ eff<br />
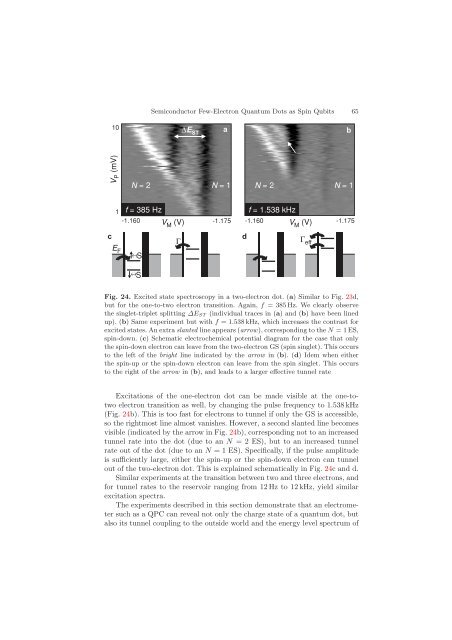
Fig. 24. Excit<strong>ed</strong> state spectroscopy in a two-electron dot. (a) Similar <strong>to</strong> Fig. 23d,<br />
but for the one-<strong>to</strong>-two electron transition. Again, f = 385 Hz. We clearly observe<br />
the singlet-triplet splitting ∆EST (individual traces in (a) and(b) have been lin<strong>ed</strong><br />
up). (b) Same experiment but with f =1.538 kHz, which increases the contrast for<br />
excit<strong>ed</strong> states. An extra slant<strong>ed</strong> line appears (arrow), corresponding <strong>to</strong> the N =1ES,<br />
spin-down. (c) Schematic electrochemical potential diagram for the case that only<br />
the spin-down electron can leave from the two-electron GS (spin singlet). This occurs<br />
<strong>to</strong> the left of the bright line indicat<strong>ed</strong> by the arrow in (b). (d) Idem when either<br />
the spin-up or the spin-down electron can leave from the spin singlet. This occurs<br />
<strong>to</strong> the right of the arrow in (b), and leads <strong>to</strong> a larger effective tunnel rate<br />
Excitations of the one-electron dot can be made visible at the one-<strong>to</strong>two<br />
electron transition as well, by changing the pulse frequency <strong>to</strong> 1.538 kHz<br />
(Fig. 24b). This is <strong>to</strong>o fast for electrons <strong>to</strong> tunnel if only the GS is accessible,<br />
so the rightmost line almost vanishes. However, a second slant<strong>ed</strong> line becomes<br />
visible (indicat<strong>ed</strong> by the arrow in Fig. 24b), corresponding not <strong>to</strong> an increas<strong>ed</strong><br />
tunnel rate in<strong>to</strong> the dot (due <strong>to</strong> an N = 2 ES), but <strong>to</strong> an increas<strong>ed</strong> tunnel<br />
rate out of the dot (due <strong>to</strong> an N = 1 ES). Specifically, if the pulse amplitude<br />
is sufficiently large, either the spin-up or the spin-down electron can tunnel<br />
out of the two-electron dot. This is explain<strong>ed</strong> schematically in Fig. 24c and d.<br />
Similar experiments at the transition between two and three electrons, and<br />
for tunnel rates <strong>to</strong> the reservoir ranging from 12 Hz <strong>to</strong> 12 kHz, yield similar<br />
excitation spectra.<br />
The experiments describ<strong>ed</strong> in this section demonstrate that an electrometer<br />
such as a QPC can reveal not only the charge state of a quantum dot, but<br />
also its tunnel coupling <strong>to</strong> the outside world and the energy level spect<strong>ru</strong>m of