Heiss W.D. (ed.) Quantum dots.. a doorway to - tiera.ru
Heiss W.D. (ed.) Quantum dots.. a doorway to - tiera.ru
Heiss W.D. (ed.) Quantum dots.. a doorway to - tiera.ru

You also want an ePaper? Increase the reach of your titles
YUMPU automatically turns print PDFs into web optimized ePapers that Google loves.
80 J.M. Elzerman et al.<br />
∆I QPC (nA)<br />
2<br />
1<br />
0<br />
a<br />
t wait<br />
0.2 0.3 0.4<br />
Time (ms)<br />
Inject<strong>ed</strong> fraction<br />
1.0<br />
0.5<br />
0.0<br />
b<br />
waiting time ( µ s):<br />
100<br />
129<br />
161<br />
195<br />
273<br />
1500<br />
1.4 1.6 1.8<br />
Injection threshold (nA)<br />
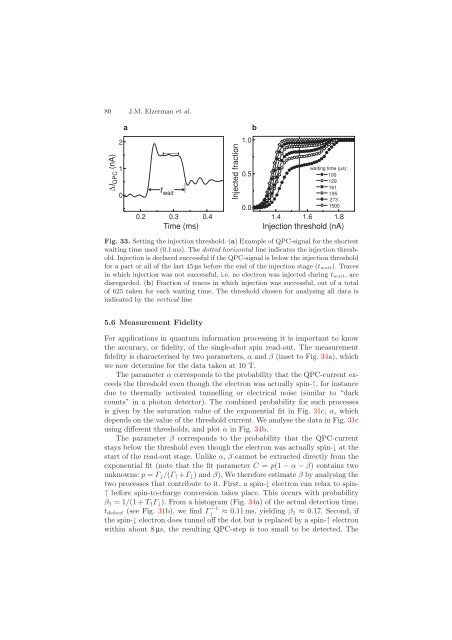
Fig. 33. Setting the injection threshold. (a) Example of QPC-signal for the shortest<br />
waiting time us<strong>ed</strong> (0.1 ms). The dott<strong>ed</strong> horizontal line indicates the injection threshold.<br />
Injection is declar<strong>ed</strong> successful if the QPC-signal is below the injection threshold<br />
for a part or all of the last 45 µs before the end of the injection stage (twait). Traces<br />
in which injection was not successful, i.e. no electron was inject<strong>ed</strong> during twait, are<br />
disregard<strong>ed</strong>. (b) Fraction of traces in which injection was successful, out of a <strong>to</strong>tal<br />
of 625 taken for each waiting time. The threshold chosen for analysing all data is<br />
indicat<strong>ed</strong> by the vertical line<br />
5.6 Measurement Fidelity<br />
For applications in quantum information processing it is important <strong>to</strong> know<br />
the accuracy, or fidelity, of the single-shot spin read-out. The measurement<br />
fidelity is characteris<strong>ed</strong> by two parameters, α and β (inset <strong>to</strong> Fig. 34a), which<br />
we now determine for the data taken at 10 T.<br />
The parameter α corresponds <strong>to</strong> the probability that the QPC-current exce<strong>ed</strong>s<br />
the threshold even though the electron was actually spin-↑, for instance<br />
due <strong>to</strong> thermally activat<strong>ed</strong> tunnelling or electrical noise (similar <strong>to</strong> “dark<br />
counts” in a pho<strong>to</strong>n detec<strong>to</strong>r). The combin<strong>ed</strong> probability for such processes<br />
is given by the saturation value of the exponential fit in Fig. 31c, α, which<br />
depends on the value of the threshold current. We analyse the data in Fig. 31c<br />
using different thresholds, and plot α in Fig. 34b.<br />
The parameter β corresponds <strong>to</strong> the probability that the QPC-current<br />
stays below the threshold even though the electron was actually spin-↓ at the<br />
start of the read-out stage. Unlike α, β cannot be extract<strong>ed</strong> directly from the<br />
exponential fit (note that the fit parameter C = p(1 − α − β) contains two<br />
unknowns: p = Γ↓/(Γ↑ +Γ↓) andβ). We therefore estimate β by analysing the<br />
two processes that contribute <strong>to</strong> it. First, a spin-↓ electron can relax <strong>to</strong> spin-<br />
↑ before spin-<strong>to</strong>-charge conversion takes place. This occurs with probability<br />
β1 =1/(1 + T1Γ↓). From a his<strong>to</strong>gram (Fig. 34a) of the actual detection time,<br />
tdetect (see Fig. 31b), we find Γ −1<br />
↓<br />
≈ 0.11 ms, yielding β1 ≈ 0.17. Second, if<br />
the spin-↓ electron does tunnel off the dot but is replac<strong>ed</strong> by a spin-↑ electron<br />
within about 8 µs, the resulting QPC-step is <strong>to</strong>o small <strong>to</strong> be detect<strong>ed</strong>. The