Estimated Fund<strong>in</strong>g Supported Per 1% Increase <strong>in</strong> Local Hotel Tax Rate: Scenario 1: 8.2% Annual Scenario 2: 3.0% Annual Revenue Growth Revenue Growth Estimated Revenue Estimated Revenue Taxable From 1% Taxable From 1% Sales (1) Tax Increase Sales (1) Tax Increase 2008 $53,456,000 $50,888,000 2009 57,839,000 52,414,000 2010 62,581,000 $626,000 53,987,000 $540,000 2011 67,712,000 677,000 55,606,000 556,000 2012 73,264,000 733,000 57,275,000 573,000 2013 79,270,000 793,000 58,993,000 590,000 2014 85,770,000 858,000 60,763,000 608,000 2015 92,802,000 928,000 62,586,000 626,000 2016 100,410,000 1,004,000 64,463,000 645,000 2017 108,643,000 1,086,000 66,397,000 664,000 2018 117,550,000 1,176,000 68,389,000 684,000 2019 127,188,000 1,272,000 70,441,000 704,000 2020 137,616,000 1,376,000 72,554,000 726,000 2021 148,898,000 1,489,000 74,730,000 747,000 2022 161,106,000 1,611,000 76,972,000 770,000 2023 174,315,000 1,743,000 79,281,000 793,000 2024 188,607,000 1,886,000 81,660,000 817,000 2025 204,070,000 2,041,000 84,110,000 841,000 2026 220,802,000 2,208,000 86,633,000 866,000 2027 238,905,000 2,389,000 89,232,000 892,000 2028 258,492,000 2,585,000 91,909,000 919,000 2029 279,685,000 2,797,000 94,666,000 947,000 NPV: 2010 - 2029 (2) $14,452,000 $7,862,000 (1) Based on actual 2007 sales, <strong>in</strong>flated <strong>by</strong> 8.2 or 3.0 percent (2) Assumes 6.0 percent discount rate As shown, if hotel sales cont<strong>in</strong>ue to grow at the 8.2 percent annual growth rate demonstrated over the past six years, it is estimated that the revenue generated <strong>by</strong> a 1.0 percent <strong>in</strong>crease <strong>in</strong> the local hotel tax rate could have an NPV of approximately $14.5 million over the 20-year period from 2010 through 2029. If hotel sales growth moderates to 3.0 percent <strong>in</strong> future years, a 1.0 percent hotel tax <strong>in</strong>crease could generate revenues with an NPV of approximately $7.9 million over a 20-year period. The actual amount of project costs funded <strong>by</strong> these revenue streams would depend on factors such as the required debt coverage ratio <strong>and</strong> other borrow<strong>in</strong>g costs. The State statutes regard<strong>in</strong>g Auditorium Districts allow the districts to enact a tax of up to 5.0 percent <strong>in</strong> their respective communities. Based on the above analysis, a 5.0 percent hotel tax could generate a 20-year NPV of $39 to $72 million. Therefore, it is possible that hotel taxes could potentially fund 100 percent of project costs, based on prelim<strong>in</strong>ary cost estimates, depend<strong>in</strong>g on required coverage ratios <strong>and</strong> other borrow<strong>in</strong>g costs. However, it should be noted that ga<strong>in</strong><strong>in</strong>g political support for the formation of an Auditorium District may be more feasible if the hotel tax rate is held below the maximum of 5.0 percent. Feasibility Analysis of a New <strong>Sports</strong> <strong>and</strong> <strong>Event</strong> <strong>Complex</strong> <strong>in</strong> <strong>Coeur</strong> d’Alene Fund<strong>in</strong>g Analysis Page 119
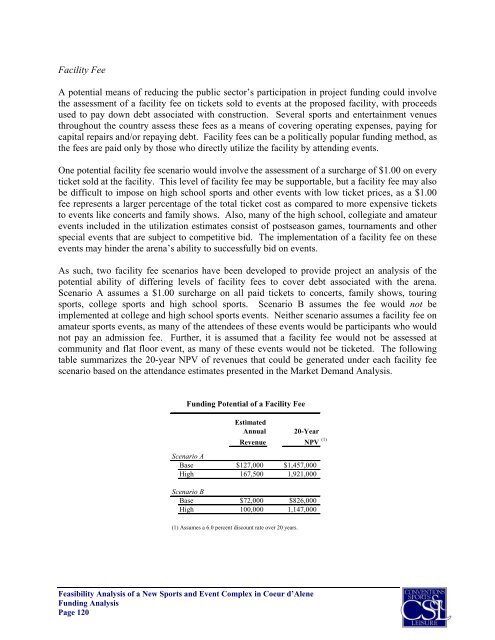
Facility Fee A potential means of reduc<strong>in</strong>g the public sector’s participation <strong>in</strong> project fund<strong>in</strong>g could <strong>in</strong>volve the assessment of a facility fee on tickets sold to events at the proposed facility, with proceeds used to pay down debt associated with construction. Several sports <strong>and</strong> enterta<strong>in</strong>ment venues throughout the country assess these fees as a means of cover<strong>in</strong>g operat<strong>in</strong>g expenses, pay<strong>in</strong>g for capital repairs <strong>and</strong>/or repay<strong>in</strong>g debt. Facility fees can be a politically popular fund<strong>in</strong>g method, as the fees are paid only <strong>by</strong> those who directly utilize the facility <strong>by</strong> attend<strong>in</strong>g events. One potential facility fee scenario would <strong>in</strong>volve the assessment of a surcharge of $1.00 on every ticket sold at the facility. This level of facility fee may be supportable, but a facility fee may also be difficult to impose on high school sports <strong>and</strong> other events with low ticket prices, as a $1.00 fee represents a larger percentage of the total ticket cost as compared to more expensive tickets to events like concerts <strong>and</strong> family shows. Also, many of the high school, collegiate <strong>and</strong> amateur events <strong>in</strong>cluded <strong>in</strong> the utilization estimates consist of postseason games, tournaments <strong>and</strong> other special events that are subject to competitive bid. The implementation of a facility fee on these events may h<strong>in</strong>der the arena’s ability to successfully bid on events. As such, two facility fee scenarios have been developed to provide project an analysis of the potential ability of differ<strong>in</strong>g levels of facility fees to cover debt associated with the arena. Scenario A assumes a $1.00 surcharge on all paid tickets to concerts, family shows, tour<strong>in</strong>g sports, college sports <strong>and</strong> high school sports. Scenario B assumes the fee would not be implemented at college <strong>and</strong> high school sports events. Neither scenario assumes a facility fee on amateur sports events, as many of the attendees of these events would be participants who would not pay an admission fee. Further, it is assumed that a facility fee would not be assessed at community <strong>and</strong> flat floor event, as many of these events would not be ticketed. The follow<strong>in</strong>g table summarizes the 20-year NPV of revenues that could be generated under each facility fee scenario based on the attendance estimates presented <strong>in</strong> the Market Dem<strong>and</strong> Analysis. Fund<strong>in</strong>g Potential of a Facility Fee Estimated Annual 20-Year Revenue NPV (1) Scenario A Base $127,000 $1,457,000 High 167,500 1,921,000 Scenario B Base $72,000 $826,000 High 100,000 1,147,000 (1) Assumes a 6.0 percent discount rate over 20 years. Feasibility Analysis of a New <strong>Sports</strong> <strong>and</strong> <strong>Event</strong> <strong>Complex</strong> <strong>in</strong> <strong>Coeur</strong> d’Alene Fund<strong>in</strong>g Analysis Page 120
- Page 1 and 2:
Feasibility Study: Proposed Sports
- Page 3 and 4:
Mr. David Tomson February 6, 2008 P
- Page 5 and 6:
- Executive Summary - Conventions,
- Page 7 and 8:
• These types of arenas can offer
- Page 9 and 10:
part of the Visitor and Convention
- Page 11 and 12:
• Because the proposed Coeur d’
- Page 13 and 14:
• As shown, the estimated operati
- Page 15 and 16:
• The following table illustrates
- Page 17 and 18:
• Based on conversations with pro
- Page 19 and 20:
Organizations and Stakeholders Cont
- Page 21 and 22:
II. Local Market Conditions Analysi
- Page 23 and 24:
The following exhibit illustrates t
- Page 25 and 26:
Income Another socioeconomic variab
- Page 27 and 28:
The Kootenai Medical Center is the
- Page 29 and 30:
Summary of Event Space at Couer d'A
- Page 31 and 32:
As shown, six indoor venues are off
- Page 33 and 34:
Spokane Convention Center The Spoka
- Page 35 and 36:
III. Comparable Facilities Analysis
- Page 37 and 38:
Budweiser Events Center Located in
- Page 39 and 40:
Qwest Arena The 5,190-seat Qwest Ar
- Page 41 and 42:
Toyota Center Originally known as t
- Page 43 and 44:
Tyson Events Center Located in Siou
- Page 45 and 46:
Comparable Arena/Convention Facilit
- Page 47 and 48:
Cabarrus Arena & Event Center Locat
- Page 49 and 50:
La Crosse Center Located in downtow
- Page 51 and 52:
Mid-America Center The Mid-America
- Page 53 and 54:
Swiftel Center The Swiftel Center i
- Page 55 and 56:
While the multi-purpose nature of t
- Page 57 and 58:
• Meetings/Banquets - Events incl
- Page 59 and 60:
Arena Football Arena football has g
- Page 61 and 62:
12,000 10,000 8,000 6,000 4,000 2,0
- Page 63 and 64:
Touring Sports Events Indoor event
- Page 65 and 66:
also serve as a valuable recruiting
- Page 67 and 68:
o Presence of a minimum of 150 comm
- Page 69 and 70:
Amateur Sports Another potential us
- Page 71 and 72:
USA Judo • Potential exists for a
- Page 73 and 74:
• The event attracts over 100 tea
- Page 75 and 76:
Conventions, Conferences, Exhibitio
- Page 77 and 78:
A facility offering a clear span co
- Page 79 and 80:
While a sports tenant could add app
- Page 81 and 82:
West Coast League Attendance Sorted
- Page 83 and 84:
The development of two fields is li
- Page 85 and 86: Seating Capacities of Regional Faci
- Page 87 and 88: Premium Seating Many modern sports
- Page 89 and 90: One option would be for the Fairgro
- Page 91 and 92: Gate Receipts/Rental Revenue Summar
- Page 93 and 94: concession profits allocated to fac
- Page 95 and 96: Parking Based on conversations with
- Page 97 and 98: Naming Rights Agreements at Selecte
- Page 99 and 100: As shown, based on an estimated 10
- Page 101 and 102: Estimated Financial Results The tot
- Page 103 and 104: Tenant Sports Impact In order to es
- Page 105 and 106: VI. Economic and Fiscal Impact Anal
- Page 107 and 108: In order to estimate the incrementa
- Page 109 and 110: The appropriate multipliers to be u
- Page 111 and 112: Based on this direct spending estim
- Page 113 and 114: Based on the in-facility spending e
- Page 115 and 116: As detailed in the previous table,
- Page 117 and 118: VII. Funding Analysis The purpose o
- Page 119 and 120: The P&R District could generate the
- Page 121 and 122: Once the referendum has passed, the
- Page 123 and 124: Year Public Contribution Facility L
- Page 125 and 126: Laredo Entertainment Center The Lar
- Page 127 and 128: Sovereign Center The 9,000-seat Sov
- Page 129 and 130: The City’s lease payments are der
- Page 131 and 132: In addition to the bonds, a $25.0 m
- Page 133 and 134: TIF The proposed event facility sit
- Page 135: Hotel/Motel Tax As discussed previo
- Page 139: Summary The intent of this section