Metal Foams: A Design Guide
Metal Foams: A Design Guide
Metal Foams: A Design Guide
- TAGS
- upload.vnuki.org
You also want an ePaper? Increase the reach of your titles
YUMPU automatically turns print PDFs into web optimized ePapers that Google loves.
Sandwich structures 135<br />
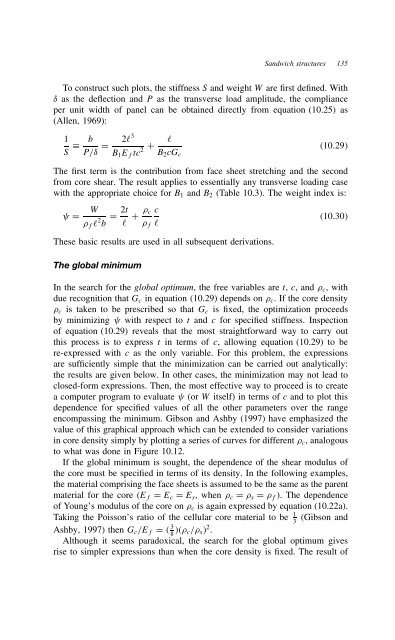
To construct such plots, the stiffness S and weight W are first defined. With<br />
υ as the deflection and P as the transverse load amplitude, the compliance<br />
per unit width of panel can be obtained directly from equation (10.25) as<br />
(Allen, 1969):<br />
1<br />
S<br />
b 2ℓ3 ℓ<br />
D C<br />
P/υ 2<br />
B1Eftc B2cGc<br />
⊲10.29⊳<br />
The first term is the contribution from face sheet stretching and the second<br />
from core shear. The result applies to essentially any transverse loading case<br />
with the appropriate choice for B1 and B2 (Table 10.3). The weight index is:<br />
D W<br />
fℓ 2 2t<br />
D C<br />
b ℓ<br />
c c<br />
f ℓ<br />
These basic results are used in all subsequent derivations.<br />
The global minimum<br />
⊲10.30⊳<br />
In the search for the global optimum, the free variables are t, c, andc, with<br />
due recognition that Gc in equation (10.29) depends on c. If the core density<br />
c is taken to be prescribed so that Gc is fixed, the optimization proceeds<br />
by minimizing with respect to t and c for specified stiffness. Inspection<br />
of equation (10.29) reveals that the most straightforward way to carry out<br />
this process is to express t in terms of c, allowing equation (10.29) to be<br />
re-expressed with c as the only variable. For this problem, the expressions<br />
are sufficiently simple that the minimization can be carried out analytically:<br />
the results are given below. In other cases, the minimization may not lead to<br />
closed-form expressions. Then, the most effective way to proceed is to create<br />
a computer program to evaluate (or W itself) in terms of c and to plot this<br />
dependence for specified values of all the other parameters over the range<br />
encompassing the minimum. Gibson and Ashby (1997) have emphasized the<br />
value of this graphical approach which can be extended to consider variations<br />
in core density simply by plotting a series of curves for different c, analogous<br />
to what was done in Figure 10.12.<br />
If the global minimum is sought, the dependence of the shear modulus of<br />
the core must be specified in terms of its density. In the following examples,<br />
the material comprising the face sheets is assumed to be the same as the parent<br />
material for the core (Ef D Ec D Es, when c D s D f). The dependence<br />
of Young’s modulus of the core on c is again expressed by equation (10.22a).<br />
Taking the Poisson’s ratio of the cellular core material to be 1 (Gibson and<br />
3<br />
Ashby, 1997) then Gc/Ef D ⊲ 3<br />
8⊳⊲ c/ s⊳2 .<br />
Although it seems paradoxical, the search for the global optimum gives<br />
rise to simpler expressions than when the core density is fixed. The result of


