Metal Foams: A Design Guide
Metal Foams: A Design Guide
Metal Foams: A Design Guide
- TAGS
- upload.vnuki.org

Create successful ePaper yourself
Turn your PDF publications into a flip-book with our unique Google optimized e-Paper software.
P 2 = 1/Loss coefficient (−)<br />
100000.<br />
10000.<br />
1000.<br />
100.<br />
10.<br />
1.<br />
0.1<br />
Cost estimation and viability 213<br />
Performance metrics for<br />
stiffness and damping<br />
;;;;;;;;;;;;;;;;;;;;;;;;;;;;;;;;;;<br />
Low alloy ;;;;;;;;;;;;;;;;;;;;;;;;;;;;;;;;;;<br />
steels<br />
;;;;;;;;;;;;;;;;;;;;;;;;;;;;;;;;;;<br />
;;;;;;;;;;;;;;;;;;;;;;;;;;;;;;;;;;<br />
;;;;;;;;;;;;;;;;;;;;;;;;;;;;;;;;;;<br />
;;;;;;;;;;;;;;;;;;;;;;;;;;;;;;;;;;<br />
;;;;;;;;;;;;;;;;;;;;;;;;;;;;;;;;;;<br />
Nyoln<br />
;;;;;;;;;;;;;;;;;;;;;;;;;;;;;;;;;;<br />
;;;;;;;;;;;;;;;;;;;;;;;;;;;;;;;;;;<br />
HDPE<br />
;;;;;;;;;;;;;;;;;;;;;;;;;;;;;;;;;;<br />
CTFE PTFE<br />
;;;;;;;;;;;;;;;;;;;;;;;;;;;;;;;;;;<br />
;;;;;;;;;;;;;;;;;;;;;;;;;;;;;;;;;;<br />
LLDPE<br />
;;;;;;;;;;;;;;;;;;;;;;;;;;;;;;;;;;<br />
;;;;;;;;;;;;;;;;;;;;;;;;;;;;;;;;;;<br />
;;;;;;;;;;;;;;;;;;;;;;;;;;;;;;;;;;<br />
;;;;;;;;;;;;;;;;;;;;;;;;;;;;;;;;;;<br />
;;;;;;;;;;;;;;;;;;;;;;;;;;;;;;;;;;<br />
Alcan<br />
Tungsten alloys<br />
Gunmetal<br />
Trade-off<br />
surface<br />
Bronzes<br />
Brasses<br />
Alulight<br />
Alporas<br />
Titanium<br />
Melamine<br />
UPVC<br />
alloys<br />
Aluminum<br />
PEEK<br />
alloys<br />
Megnesium<br />
alloys<br />
Cast irons Tin alloys<br />
Sn-Sb alloys<br />
Lead alloys<br />
Pure lead<br />
MDPE<br />
Ionomer (IO) LDPE<br />
1.<br />
P 1 = Density/modulus (Mg/m 3 /GPa)<br />
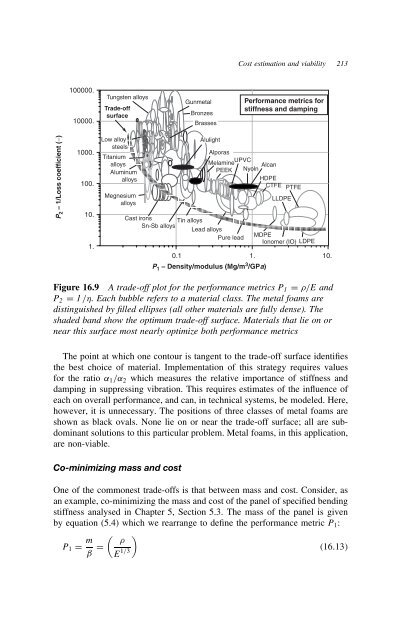
Figure 16.9 A trade-off plot for the performance metrics P1 D /E and<br />
P2 D 1 / . Each bubble refers to a material class. The metal foams are<br />
distinguished by filled ellipses (all other materials are fully dense). The<br />
shaded band show the optimum trade-off surface. Materials that lie on or<br />
near this surface most nearly optimize both performance metrics<br />
The point at which one contour is tangent to the trade-off surface identifies<br />
the best choice of material. Implementation of this strategy requires values<br />
for the ratio ˛1/˛2 which measures the relative importance of stiffness and<br />
damping in suppressing vibration. This requires estimates of the influence of<br />
each on overall performance, and can, in technical systems, be modeled. Here,<br />
however, it is unnecessary. The positions of three classes of metal foams are<br />
shown as black ovals. None lie on or near the trade-off surface; all are subdominant<br />
solutions to this particular problem. <strong>Metal</strong> foams, in this application,<br />
are non-viable.<br />
Co-minimizing mass and cost<br />
One of the commonest trade-offs is that between mass and cost. Consider, as<br />
an example, co-minimizing the mass and cost of the panel of specified bending<br />
stiffness analysed in Chapter 5, Section 5.3. The mass of the panel is given<br />
by equation (5.4) which we rearrange to define the performance metric P1:<br />
P1 D m<br />
ˇ D<br />
� �<br />
⊲16.13⊳<br />
E 1/3<br />
10.