Metal Foams: A Design Guide
Metal Foams: A Design Guide
Metal Foams: A Design Guide
- TAGS
- upload.vnuki.org

Create successful ePaper yourself
Turn your PDF publications into a flip-book with our unique Google optimized e-Paper software.
Characterization methods 33<br />
ž Proportional axisymmetric stress paths are explored in the following way.<br />
The direction of stressing is defined by the relation m D e, with the<br />
D (for uniaxial compression)<br />
3<br />
1<br />
parameter taking values over the range<br />
to D1(for hydrostatic compression). In a typical proportional loading<br />
experiment, the hydrostatic pressure and the axial load are increased in<br />
small increments keeping constant. The axial displacement are measured<br />
at each load increment and are used to define the axial strain.<br />
Yield surface measurements<br />
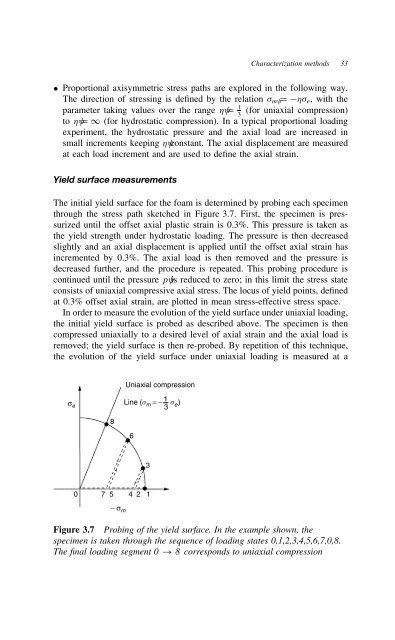
The initial yield surface for the foam is determined by probing each specimen<br />
through the stress path sketched in Figure 3.7. First, the specimen is pressurized<br />
until the offset axial plastic strain is 0.3%. This pressure is taken as<br />
the yield strength under hydrostatic loading. The pressure is then decreased<br />
slightly and an axial displacement is applied until the offset axial strain has<br />
incremented by 0.3%. The axial load is then removed and the pressure is<br />
decreased further, and the procedure is repeated. This probing procedure is<br />
continued until the pressure p is reduced to zero; in this limit the stress state<br />
consists of uniaxial compressive axial stress. The locus of yield points, defined<br />
at 0.3% offset axial strain, are plotted in mean stress-effective stress space.<br />
In order to measure the evolution of the yield surface under uniaxial loading,<br />
the initial yield surface is probed as described above. The specimen is then<br />
compressed uniaxially to a desired level of axial strain and the axial load is<br />
removed; the yield surface is then re-probed. By repetition of this technique,<br />
the evolution of the yield surface under uniaxial loading is measured at a<br />
σ e<br />
8<br />
6<br />
3<br />
0 7 5 4 2 1<br />
− σ m<br />
Uniaxial compression<br />
Line (sm = −<br />
1<br />
s<br />
3<br />
e)<br />
Figure 3.7 Probing of the yield surface. In the example shown, the<br />
specimen is taken through the sequence of loading states 0,1,2,3,4,5,6,7,0,8.<br />
The final loading segment 0 ! 8 corresponds to uniaxial compression