- Page 1 and 2:
Draft Red Herring Prospectus Decemb
- Page 3 and 4:
SECTION I DEFINITIONS AND ABBREVIAT
- Page 5 and 6:
Term Description Designated Date Th
- Page 7 and 8:
Term Description Bhandup ( West), M
- Page 9 and 10:
IPO Initial Public Offer ISO Intern
- Page 11 and 12:
FORWARD-LOOKING STATEMENTS This Dra
- Page 13 and 14:
the tax on the additional income of
- Page 15 and 16:
Risk relating to the project 6. The
- Page 17 and 18:
amount(s) due to our lender(s), not
- Page 19 and 20:
utilized portion of the licence. Ad
- Page 21 and 22:
protect us from entire liability fo
- Page 23 and 24:
6. Terrorist attacks and other acts
- Page 25 and 26:
12. Investors are advised to go thr
- Page 27 and 28:
The Indian Architectural float glas
- Page 29 and 30:
BRIEF DETAILS OF THE ISSUE Equity S
- Page 31 and 32:
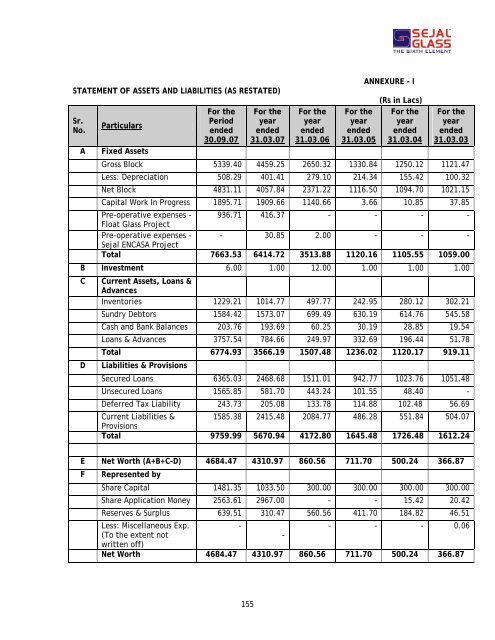
Share Application Money 2563.61 296
- Page 33 and 34:
D Net Profit after Tax but before E
- Page 35 and 36:
Issue Management Team Book Running
- Page 37 and 38:
Bank of India Banking Branch M.D.I.
- Page 39 and 40:
Pursuant to recent amendments to th
- Page 41 and 42:
Name and Address of the Underwriter
- Page 43 and 44:
5 Subdivision of Equity shares of R
- Page 45 and 46:
Mr. Mitesh K. Gada* Mr. Shantilal S
- Page 47 and 48:
Capital would be locked-in for a pe
- Page 49 and 50:
Friends, Relatives and Others 36,74
- Page 51 and 52:
3. August 30, 2007 Mr. Nilesh S. Bh
- Page 53 and 54:
Vinod Velji Shah HUF jointly with M
- Page 55 and 56:
9. November 22, 2007 Ms. Diwaliben
- Page 57 and 58:
5 Mr. Kanji V. Gada 6,16,250 3.37 6
- Page 59 and 60:
SECTION V- OBJECTS OF THE ISSUE OBJ
- Page 61 and 62:
a. Plant & Machinery - Imported i.
- Page 63 and 64:
Work-in-progress 0.43 months 430.00
- Page 65 and 66:
We propose to raise Rs. [•] Lacs
- Page 67 and 68:
Authority for the issue The Issue h
- Page 69 and 70:
BASIS FOR ISSUE PRICE The issue pri
- Page 71 and 72:
ii. Lowest - Haldyn Glass Gujarat 5
- Page 73 and 74:
Benefits available to the Company u
- Page 75 and 76:
8. In case of a shareholder being a
- Page 77 and 78:
Benefits available to other Non-Res
- Page 79 and 80:
Benefits available to Mutual Funds
- Page 81 and 82:
Source: Central Statistical Organis
- Page 83 and 84:
� Fused silica glass - Fused sili
- Page 85 and 86:
The Total Float Glass Manufactured
- Page 87 and 88:
increasing demand for hotels/resort
- Page 89 and 90:
• Hygenic - Glass is a non-porous
- Page 91 and 92:
2. High productive and reliable pro
- Page 93 and 94:
We view geographical expansion of o
- Page 95 and 96:
Features 93 Toughened Glass is appr
- Page 97 and 98:
The excellent dampening property of
- Page 99 and 100:
Brief description of the Processes
- Page 101 and 102:
c) Lamination Process Process First
- Page 103 and 104:
101
- Page 105 and 106: As the batch materials melt into so
- Page 107 and 108: Apollo Hospital Dhaka, Bangladesh B
- Page 109 and 110: Availability of Nitrogen and Hydrog
- Page 111 and 112: With the knowledge and experience o
- Page 113 and 114: Further our company proposes to imp
- Page 115 and 116: Sr. No Name of the trademark regist
- Page 117 and 118: 7. Sale deed dated July 14, 2004 be
- Page 119 and 120: 3. Standard fire and Special perils
- Page 121 and 122: May 21, 2007. Premium Amount Rs. 6,
- Page 123 and 124: KEY INDUSTRY REGULATIONS AND POLICI
- Page 125 and 126: Changes in the Registered Office of
- Page 127 and 128: 2. Non-Compete Agreement between ou
- Page 129 and 130: Sr. No. Name, Age, Designation, Fat
- Page 131 and 132: Sr. No. Name, Age, Designation, Fat
- Page 133 and 134: Compensation to Managing Director/W
- Page 135 and 136: Mr. Mitesh K. Gada, Whole-Time Dire
- Page 137 and 138: Leave travel concession for self an
- Page 139 and 140: emuneration payable to the said Dir
- Page 141 and 142: • To look into the reasons for su
- Page 143 and 144: extent of remuneration and/or reimb
- Page 145 and 146: ORGANISATION CHART OF OUR COMPANY 1
- Page 147 and 148: Sr. No Name, Age and Designatio n S
- Page 149 and 150: OUR PROMOTER AND THEIR BACKGROUND T
- Page 151 and 152: MR. SHANTILAL S. GADA Identificatio
- Page 153 and 154: CURRENCY OF PRESENTATION All refere
- Page 155: 1 st December, 2007 The Board of Di
- Page 159 and 160: NOTES TO RESTATED PROFIT AND LOSS A
- Page 161 and 162: the provision for deferred tax, tim
- Page 163 and 164: ANNEXURE - V Accounting Ratios (Rec
- Page 165 and 166: LOANS AND ADVANCES (UNSECURED, CONS
- Page 167 and 168: Annexure XII (Rs. in lacs) Details
- Page 169 and 170: f Bank of India g Axis Bank 4 Vehic
- Page 171 and 172: ANNEXURE - XIV RELATED PARTY TRANSA
- Page 173 and 174: Travelling Expenses Insurance Premi
- Page 175 and 176: Unsecured Loan received/refund Unse
- Page 177 and 178: FDR refunded 2.50 Interest paid on
- Page 179 and 180: 17 Kanji Gada FDR received FDR refu
- Page 181 and 182: 26 Shantilal Gada Interest paid on
- Page 183 and 184: CAPITALIZATION STATEMENT ANNEXURE X
- Page 185 and 186: 1. The company has generally been r
- Page 187 and 188: FINANCIAL INFORMATION OF GROUP COMP
- Page 189 and 190: 2. Sejal International Limited Seja
- Page 191 and 192: Shareholding Pattern: The Sharehold
- Page 193 and 194: 27 Mr. Hasmukh B. Shah 5000 0.09 28
- Page 195 and 196: 5. Sejal Finance Limited. Sejal Fin
- Page 197 and 198: 2. Mitesh Textiles Mitesh Textiles
- Page 199 and 200: Companies with which the Promoters
- Page 201 and 202: FACTORS AFFECTING OUR RESULTS OF OP
- Page 203 and 204: % to Turnover 65.72% 69.06% 63.03%
- Page 205 and 206: Fiscal 2005 Vs 2006 Income Income f
- Page 207 and 208:
Related Party Transactions For deta
- Page 209 and 210:
SECTION VIII - LEGAL AND REGULATORY
- Page 211 and 212:
A complaint bearing Complaint No. 6
- Page 213 and 214:
Sejal Glass House has not filed any
- Page 215 and 216:
STATUTORY APPROVALS AND LICENSES Ex
- Page 217 and 218:
6. Occupancy Certificate bearing no
- Page 219 and 220:
Sr. No. Details License No. 1. EPCG
- Page 221 and 222:
4. Application bearing no. 1371940
- Page 223 and 224:
OR (b)(ii) There shall be compulsor
- Page 225 and 226:
FROM ALL THE STOCK EXCHANGES MENTIO
- Page 227 and 228:
Further, each Bidder where required
- Page 229 and 230:
Expert Opinion Except as stated oth
- Page 231 and 232:
This being an initial public offeri
- Page 233 and 234:
Principal Terms and Conditions of t
- Page 235 and 236:
� to register himself or herself
- Page 237 and 238:
ISSUE STRUCTURE This Issue is being
- Page 239 and 240:
In case the Bid-Cum-Application For
- Page 241 and 242:
2. Hindu Undivided Families or HUFs
- Page 243 and 244:
please refer the section titled “
- Page 245 and 246:
published in two national newspaper
- Page 247 and 248:
Escrow Collection Banks shall trans
- Page 249 and 250:
Build Up of the Book and Revision o
- Page 251 and 252:
(j) In terms of SEBI Guidelines, QI
- Page 253 and 254:
c) Ensure that the details about De
- Page 255 and 256:
IT IS MANDATORY FOR ALL THE BIDDERS
- Page 257 and 258:
1. On the Bid-cum-Application Form
- Page 259 and 260:
Submission of Bid-cum-Application F
- Page 261 and 262:
Grounds for Technical Rejections Bi
- Page 263 and 264:
) The Bidder must necessarily fill
- Page 265 and 266:
Save and except refunds effected th
- Page 267 and 268:
(iii) Under-subscription below 5% o
- Page 269 and 270:
if any, for encashing such cheques,
- Page 271 and 272:
RESTRICTIONS ON FOREIGN OWNERSHIP O
- Page 273 and 274:
SECTION X- DESCRIPTION OF EQUITY SH
- Page 275 and 276:
MODIFICATION OF RIGHTS Title of Art
- Page 277 and 278:
Title of Article Article Number and
- Page 279 and 280:
Title of Article Article Number and
- Page 281 and 282:
Title of Article Article Number and
- Page 283 and 284:
Title of Article Article Number and
- Page 285 and 286:
TRANSFER AND TRANSMISSION OF SHARES
- Page 287 and 288:
Title of Article Article Number and
- Page 289 and 290:
Title of Article Article Number and
- Page 291 and 292:
Title of Article Article Number and
- Page 293 and 294:
Title of Article Article Number and
- Page 295 and 296:
Title of Article Article Number and
- Page 297 and 298:
Title of Article Article Number and
- Page 299 and 300:
Title of Article Article Number and
- Page 301 and 302:
Title of Article Article Number and
- Page 303 and 304:
Title of Article Article Number and
- Page 305 and 306:
SECTION XI -OTHER INFORMATION MATER
- Page 307:
23. SEBI observation letter no. [