

BoletÃn EstadÃstico de Minas y EnergÃa 2007 - 2011 - simco
BoletÃn EstadÃstico de Minas y EnergÃa 2007 - 2011 - simco
BoletÃn EstadÃstico de Minas y EnergÃa 2007 - 2011 - simco

You also want an ePaper? Increase the reach of your titles
YUMPU automatically turns print PDFs into web optimized ePapers that Google loves.
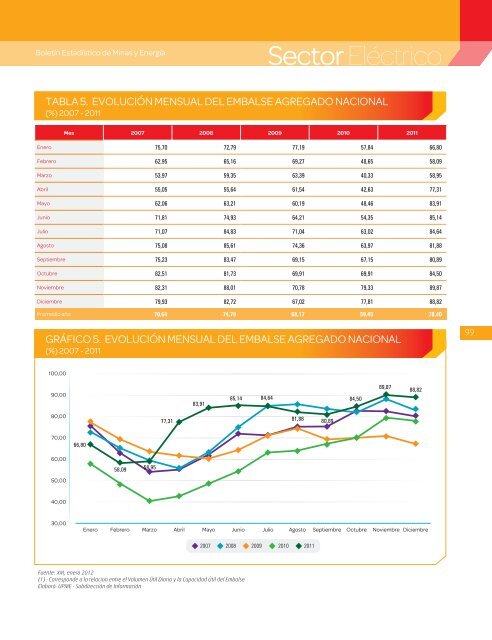
Boletín Estadístico <strong>de</strong> <strong>Minas</strong> y EnergíaSector EléctricoTABLA 5. EVOLUCIÓN MENSUAL DEL EMBALSE AGREGADO NACIONAL(%) <strong>2007</strong> - <strong>2011</strong>Mes <strong>2007</strong> 2008 2009 2010 <strong>2011</strong>Enero 75,70 72,79 77,19 57,84 66,80Febrero 62,95 65,16 69,27 48,65 58,09Marzo 53,97 59,35 63,39 40,33 58,95Abril 55,05 55,64 61,54 42,63 77,31Mayo 62,06 63,21 60,19 48,46 83,91Junio 71,81 74,93 64,21 54,35 85,14Julio 71,07 84,83 71,04 63,02 84,64Agosto 75,08 85,61 74,36 63,97 81,88Septiembre 75,23 83,47 69,15 67,15 80,89Octubre 82,51 81,73 69,91 69,91 84,50Noviembre 82,31 88,01 70,78 79,33 89,87Diciembre 79,93 82,72 67,02 77,81 88,82Promedio año 70,64 74,79 68,17 59,45 78,40GRÁFICO 5. EVOLUCIÓN MENSUAL DEL EMBALSE AGREGADO NACIONAL(%) <strong>2007</strong> - <strong>2011</strong>99100,0090,0083,9185,14 84,6484,5089,8788,8280,0077,3181,88 80,8970,0066,8060,0050,0058,0958,9540,0030,00Enero Febrero Marzo Abril Mayo Junio Julio Agosto Septiembre Octubre Noviembre Diciembre<strong>2007</strong> 2008 2009 2010 <strong>2011</strong>Fuente: XM, enero 2012(1) : Correspon<strong>de</strong> a la relacion entre el Volumen Útil Diario y la Capacidad Útil <strong>de</strong>l EmbalseElaboró: UPME - Subdirección <strong>de</strong> Información


