

BoletÃn EstadÃstico de Minas y EnergÃa 2007 - 2011 - simco
BoletÃn EstadÃstico de Minas y EnergÃa 2007 - 2011 - simco
BoletÃn EstadÃstico de Minas y EnergÃa 2007 - 2011 - simco

You also want an ePaper? Increase the reach of your titles
YUMPU automatically turns print PDFs into web optimized ePapers that Google loves.
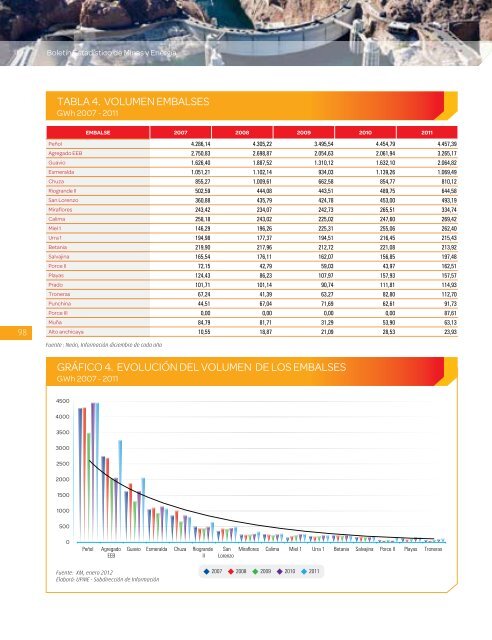
Boletín Estadístico <strong>de</strong> <strong>Minas</strong> y EnergíaTABLA 4. VOLUMEN EMBALSESGWh <strong>2007</strong> - <strong>2011</strong>EMBALSE <strong>2007</strong> 2008 2009 2010 <strong>2011</strong>98Peñol 4.286,14 4.305,22 3.495,54 4.454,79 4.457,39Agregado EEB 2.750,83 2.698,87 2.054,63 2.061,94 3.265,17Guavio 1.626,40 1.887,52 1.310,12 1.632,10 2.064,82Esmeralda 1.051,21 1.102,14 934,03 1.139,26 1.069,49Chuza 855,27 1.009,61 662,58 854,77 810,12Riogran<strong>de</strong> II 502,59 444,08 443,51 489,75 644,58San Lorenzo 360,88 435,79 424,78 453,00 493,19Miraflores 243,42 234,07 242,73 265,51 334,74Calima 258,18 243,02 225,02 247,60 269,42Miel 1 146,29 196,26 225,31 255,06 262,40Urra 1 194,98 177,37 194,51 216,45 215,43Betania 219,90 217,96 212,72 221,08 213,92Salvajina 165,54 176,11 162,07 156,85 197,48Porce II 72,15 42,79 59,03 43,97 162,51Playas 124,43 86,23 107,97 157,93 157,57Prado 101,71 101,14 90,74 111,81 114,93Troneras 67,24 41,39 63,27 82,80 112,70Punchina 44,51 67,04 71,69 62,61 91,73Porce III 0,00 0,00 0,00 0,00 87,61Muña 84,79 81,71 31,29 53,90 63,13Alto anchicaya 10,55 18,87 21,09 28,53 23,93Fuente : Neón, Información diciembre <strong>de</strong> cada añoGRÁFICO 4. EVOLUCIÓN DEL VOLUMEN DE LOS EMBALSESGWh <strong>2007</strong> - <strong>2011</strong>450040003500300025002000150010005000PeñolAgregadoEEBGuavio Esmeralda Chuza Riogran<strong>de</strong>IISanLorenzoMiraflores Calima Miel 1 Urra 1 Betania Salvajina Porce II Playas TronerasFuente: XM, enero 2012Elaboró: UPME - Subdirección <strong>de</strong> Información<strong>2007</strong> 2008 2009 2010 <strong>2011</strong>


