

BoletÃn EstadÃstico de Minas y EnergÃa 2007 - 2011 - simco
BoletÃn EstadÃstico de Minas y EnergÃa 2007 - 2011 - simco
BoletÃn EstadÃstico de Minas y EnergÃa 2007 - 2011 - simco

Create successful ePaper yourself
Turn your PDF publications into a flip-book with our unique Google optimized e-Paper software.
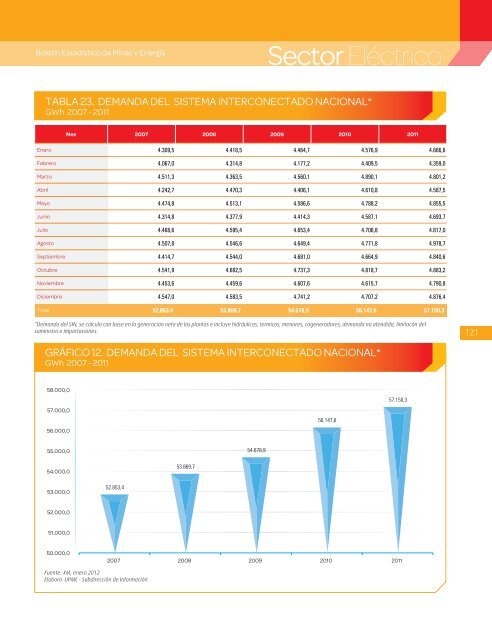
Boletín Estadístico <strong>de</strong> <strong>Minas</strong> y EnergíaSector EléctricoTABLA 23. DEMANDA DEL SISTEMA INTERCONECTADO NACIONAL*GWh <strong>2007</strong> - <strong>2011</strong>Mes <strong>2007</strong> 2008 2009 2010 <strong>2011</strong>Enero 4.309,5 4.418,5 4.464,7 4.576,9 4.666,6Febrero 4.067,0 4.314,8 4.177,2 4.409,5 4.359,0Marzo 4.511,3 4.363,5 4.560,1 4.890,1 4.801,2Abril 4.242,7 4.470,3 4.406,1 4.610,8 4.587,5Mayo 4.474,8 4.513,1 4.586,6 4.788,2 4.855,5Junio 4.314,8 4.377,9 4.414,3 4.587,1 4.693,7Julio 4.468,6 4.595,4 4.653,4 4.706,8 4.817,0Agosto 4.507,8 4.546,6 4.649,4 4.771,8 4.978,7Septiembre 4.414,7 4.544,0 4.681,0 4.664,9 4.840,6Octubre 4.541,9 4.682,5 4.737,3 4.818,7 4.883,2Noviembre 4.453,6 4.459,6 4.607,6 4.615,7 4.790,8Diciembre 4.547,0 4.583,5 4.741,2 4.707,2 4.876,4Total 52.853,4 53.869,7 54.678,9 56.147,6 57.150,3*Demanda <strong>de</strong>l SIN, se calcula con base en la generación neta <strong>de</strong> las plantas e incluye hidráulicas, termicas, menores, cogeneradores, <strong>de</strong>manda no atendida, limitacón <strong>de</strong>lsuministro e importaciones.121GRÁFICO 12. DEMANDA DEL SISTEMA INTERCONECTADO NACIONAL*GWh <strong>2007</strong> - <strong>2011</strong>58.000,057.000,056.000,056.147,657.150,355.000,054.678,954.000,053.869,753.000,052.853,452.000,051.000,050.000,0<strong>2007</strong> 2008 2009 2010 <strong>2011</strong>Fuente: XM, enero 2012Elaboró: UPME - Subdirección <strong>de</strong> Información


