

BoletÃn EstadÃstico de Minas y EnergÃa 2007 - 2011 - simco
BoletÃn EstadÃstico de Minas y EnergÃa 2007 - 2011 - simco
BoletÃn EstadÃstico de Minas y EnergÃa 2007 - 2011 - simco

You also want an ePaper? Increase the reach of your titles
YUMPU automatically turns print PDFs into web optimized ePapers that Google loves.
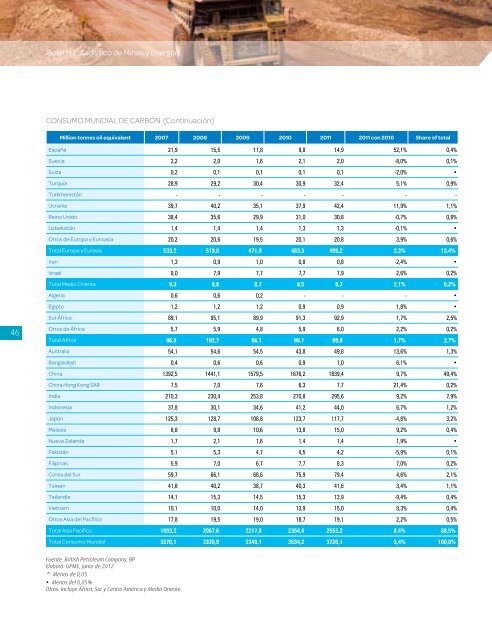
Boletín Estadístico <strong>de</strong> <strong>Minas</strong> y EnergíaCONSUMO MUNDIAL DE CARBÓN (Continuación)Million tonnes oil equivalent <strong>2007</strong> 2008 2009 2010 <strong>2011</strong> <strong>2011</strong> con 2010 Share of totalEspaña 21,9 15,5 11,8 9,8 14,9 52,1% 0,4%Suecia 2,2 2,0 1,6 2,1 2,0 -8,0% 0,1%Suiza 0,2 0,1 0,1 0,1 0,1 -2,0% •Turquía 28,9 29,2 30,4 30,9 32,4 5,1% 0,9%Turkmenistán - - - - - - -Ucrania 39,7 40,2 35,1 37,9 42,4 11,9% 1,1%Reino Unido 38,4 35,6 29,9 31,0 30,8 -0,7% 0,8%Uzbekistán 1,4 1,4 1,4 1,3 1,3 -0,1% •Otros <strong>de</strong> Europa y Euroasia 20,2 20,6 19,5 20,1 20,8 3,9% 0,6%Total Europe y Eurasia 533,2 519,8 471,0 483,3 499,2 3,3% 13,4%Iran 1,3 0,9 1,0 0,8 0,8 -2,4% •Israel 8,0 7,9 7,7 7,7 7,9 2,6% 0,2%Total Medio Oriente 9,3 8,8 8,7 8,5 8,7 2,1% 0,2%Algeria 0,6 0,6 0,2 - - - •Egipto 1,2 1,2 1,2 0,9 0,9 1,8% •Sur África 89,1 95,1 89,9 91,3 92,9 1,7% 2,5%46Otros <strong>de</strong> África 5,7 5,9 4,8 5,9 6,0 2,2% 0,2%Total Africa 96,5 102,7 96,1 98,1 99,8 1,7% 2,7%Australia 54,1 54,6 54,5 43,8 49,8 13,6% 1,3%Bangla<strong>de</strong>sh 0,4 0,6 0,6 0,9 1,0 6,1% •China 1392,5 1441,1 1579,5 1676,2 1839,4 9,7% 49,4%China Hong Kong SAR 7,5 7,0 7,6 6,3 7,7 21,4% 0,2%India 210,3 230,4 253,8 270,8 295,6 9,2% 7,9%Indonesia 37,8 30,1 34,6 41,2 44,0 6,7% 1,2%Japon 125,3 128,7 108,8 123,7 117,7 -4,8% 3,2%Malasia 8,8 9,8 10,6 13,8 15,0 9,2% 0,4%Nueva Zelanda 1,7 2,1 1,6 1,4 1,4 1,9% •Pakistán 5,1 5,3 4,7 4,5 4,2 -5,9% 0,1%Filipinas 5,9 7,0 6,7 7,7 8,3 7,0% 0,2%Corea <strong>de</strong>l Sur 59,7 66,1 68,6 75,9 79,4 4,6% 2,1%Taiwan 41,8 40,2 38,7 40,3 41,6 3,4% 1,1%Tailandia 14,1 15,3 14,5 15,3 13,9 -9,4% 0,4%Vietnam 10,1 10,0 14,0 13,9 15,0 8,3% 0,4%Otros Asia <strong>de</strong>l Pacífico 17,8 19,5 19,0 18,7 19,1 2,2% 0,5%Total Asia Pacifico 1993,2 2067,6 2217,8 2354,4 2553,2 8,4% 68,5%Total Consumo Mundial 3270,1 3326,9 3349,1 3534,2 3726,1 5,4% 100,0%Fuente: British Petroleum Company, BPElaboró: UPME, junio <strong>de</strong> 2012^ Menos <strong>de</strong> 0,05• Menos <strong>de</strong>l 0,05%Otros: Incluye África, Sur y Centro América y Medio Oriente.


