BoletÃn EstadÃstico de Minas y EnergÃa 2007 - 2011 - simco
BoletÃn EstadÃstico de Minas y EnergÃa 2007 - 2011 - simco
BoletÃn EstadÃstico de Minas y EnergÃa 2007 - 2011 - simco
Create successful ePaper yourself
Turn your PDF publications into a flip-book with our unique Google optimized e-Paper software.
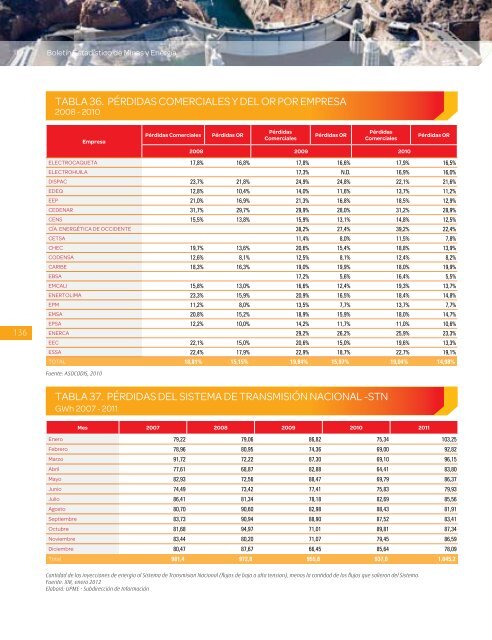
Boletín Estadístico <strong>de</strong> <strong>Minas</strong> y EnergíaTABLA 36. PÉRDIDAS COMERCIALES Y DEL OR POR EMPRESA2008 - 2010136EmpresaPérdidas ComercialesPérdidas ORPérdidasComercialesPérdidas ORPérdidasComerciales2008 2009 2010Pérdidas ORELECTROCAQUETA 17,8% 16,8% 17,8% 16,6% 17,9% 16,5%ELECTROHUILA 17,3% N.D. 16,9% 16,0%DISPAC 23,7% 21,8% 24,9% 24,8% 22,1% 21,6%EDEQ 12,8% 10,4% 14,0% 11,6% 13,7% 11,2%EEP 21,0% 16,9% 21,3% 16,8% 18,5% 12,9%CEDENAR 31,7% 29,7% 29,9% 28,0% 31,2% 28,9%CENS 15,5% 13,8% 15,9% 13,1% 14,8% 12,5%CÍA. ENERGÉTICA DE OCCIDENTE 38,2% 27,4% 39,2% 22,4%CETSA 11,4% 8,0% 11,5% 7,8%CHEC 19,7% 13,6% 20,6% 15,4% 18,8% 13,9%CODENSA 12,6% 8,1% 12,5% 8,1% 12,4% 8,2%CARIBE 18,3% 16,3% 19,0% 19,9% 18,0% 19,9%EBSA 17,2% 5,6% 16,4% 5,5%EMCALI 15,8% 13,0% 16,6% 12,4% 19,3% 13,7%ENERTOLIMA 23,3% 15,9% 20,9% 16,5% 18,4% 14,8%EPM 11,2% 8,0% 13,5% 7,7% 13,7% 7,7%EMSA 20,8% 15,2% 18,9% 15,9% 18,0% 14,7%EPSA 12,2% 10,0% 14,2% 11,7% 11,0% 10,6%ENERCA 29,2% 26,2% 25,9% 23,3%EEC 22,1% 15,0% 20,6% 15,0% 19,6% 13,3%ESSA 22,4% 17,9% 22,9% 18,7% 22,7% 19,1%TOTAL 18,81% 15,15% 19,84% 15,97% 19,04% 14,98%Fuente: ASOCODIS, 2010TABLA 37. PÉRDIDAS DEL SISTEMA DE TRANSMISIÓN NACIONAL -STNGWh <strong>2007</strong> - <strong>2011</strong>Mes <strong>2007</strong> 2008 2009 2010 <strong>2011</strong>Enero 79,22 79,06 86,82 75,34 103,25Febrero 78,96 80,95 74,36 69,00 92,82Marzo 91,72 72,22 87,30 69,10 96,15Abril 77,61 68,87 82,88 64,41 83,80Mayo 82,93 72,56 88,47 69,79 86,37Junio 74,49 73,42 77,41 75,83 79,93Julio 86,41 81,34 78,18 82,69 85,56Agosto 80,70 90,60 82,98 88,43 81,91Septiembre 83,73 90,94 88,90 87,52 83,41Octubre 81,68 94,97 71,01 89,81 87,34Noviembre 83,44 80,20 71,07 79,45 86,59Diciembre 80,47 87,67 66,45 85,64 78,09Total 981,4 972,8 955,8 937,0 1.045,2Cantidad <strong>de</strong> las inyecciones <strong>de</strong> energia al Sistema <strong>de</strong> Transmision Nacional (flujos <strong>de</strong> baja a alta tension), menos la cantidad <strong>de</strong> los flujos que salieron <strong>de</strong>l Sistema.Fuente: XM, enero 2012Elaboró: UPME - Subdirección <strong>de</strong> Información


