

BoletÃn EstadÃstico de Minas y EnergÃa 2007 - 2011 - simco
BoletÃn EstadÃstico de Minas y EnergÃa 2007 - 2011 - simco
BoletÃn EstadÃstico de Minas y EnergÃa 2007 - 2011 - simco

Create successful ePaper yourself
Turn your PDF publications into a flip-book with our unique Google optimized e-Paper software.
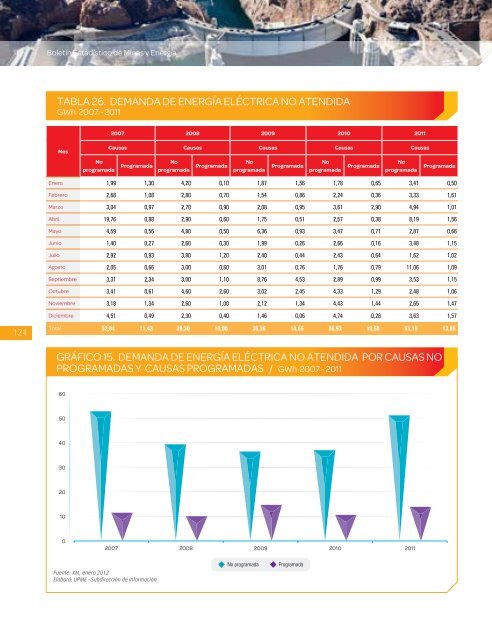
Boletín Estadístico <strong>de</strong> <strong>Minas</strong> y EnergíaTABLA 26. DEMANDA DE ENERGÍA ELÉCTRICA NO ATENDIDAGWh <strong>2007</strong> - <strong>2011</strong><strong>2007</strong> 2008 2009 2010 <strong>2011</strong>MesCausas Causas Causas Causas CausasNoprogramada Programada Noprogramada Programada NoprogramadaProgramadaNoprogramadaProgramadaNoprogramadaProgramadaEnero 1,99 1,30 4,20 0,10 1,87 1,56 1,78 0,65 3,41 0,50Febrero 2,68 1,08 2,80 0,70 1,54 0,86 2,24 0,36 3,33 1,61Marzo 3,04 0,97 2,70 0,90 2,08 0,95 3,61 2,90 4,94 1,01Abril 19,76 0,88 2,90 0,60 1,75 0,51 2,57 0,38 8,19 1,56Mayo 4,59 0,56 4,80 0,50 6,36 0,93 3,47 0,71 2,87 0,66Junio 1,40 0,27 2,60 0,30 1,99 0,26 2,66 0,16 3,48 1,15Julio 2,92 0,93 3,80 1,20 2,40 0,44 2,43 0,64 1,62 1,02Agosto 2,05 0,66 3,00 0,60 3,01 0,76 1,76 0,79 11,06 1,09Septiembre 3,31 2,34 3,00 1,10 8,76 4,53 2,89 0,99 3,53 1,15Octubre 3,41 0,61 4,60 2,60 3,02 2,45 4,33 1,29 2,48 1,06Noviembre 3,18 1,34 2,60 1,00 2,12 1,34 4,43 1,44 2,65 1,47Diciembre 4,51 0,49 2,30 0,40 1,46 0,06 4,74 0,28 3,63 1,57124Total 52,84 11,43 39,30 10,00 36,36 14,65 36,93 10,58 51,19 13,85GRÁFICO 15. DEMANDA DE ENERGÍA ELÉCTRICA NO ATENDIDA POR CAUSAS NOPROGRAMADAS Y CAUSAS PROGRAMADAS / GWh <strong>2007</strong> - <strong>2011</strong>6050403020100<strong>2007</strong> 2008 2009 2010 <strong>2011</strong>Fuente: XM, enero 2012Elaboró: UPME - Subdirección <strong>de</strong> InformaciónNo programada Programada


