

BoletÃn EstadÃstico de Minas y EnergÃa 2007 - 2011 - simco
BoletÃn EstadÃstico de Minas y EnergÃa 2007 - 2011 - simco
BoletÃn EstadÃstico de Minas y EnergÃa 2007 - 2011 - simco

Create successful ePaper yourself
Turn your PDF publications into a flip-book with our unique Google optimized e-Paper software.
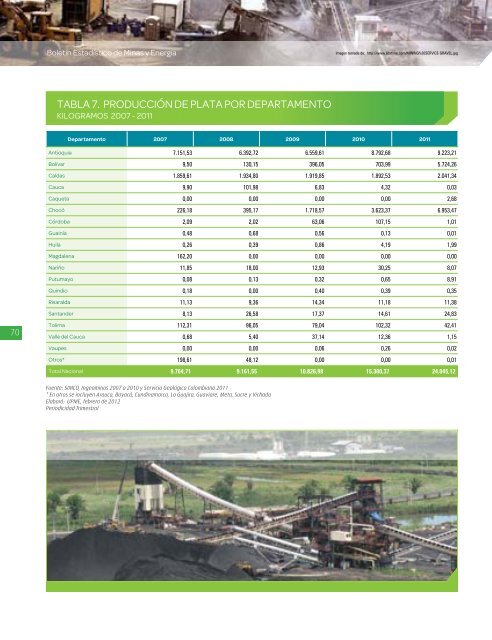
Boletín Estadístico <strong>de</strong> <strong>Minas</strong> y EnergíaImagen tomada <strong>de</strong>: http://www.lidstone.com/MINING%20SERVICE-GRAVEL.jpgTABLA 7. PRODUCCIÓN DE PLATA POR DEPARTAMENTOKILOGRAMOS <strong>2007</strong> - <strong>2011</strong>Departamento <strong>2007</strong> 2008 2009 2010 <strong>2011</strong>Antioquia 7.151,53 6.392,72 6.559,61 8.792,68 9.223,21Bolívar 9,50 130,15 396,05 703,99 5.724,26Caldas 1.859,61 1.934,80 1.919,85 1.892,53 2.041,34Cauca 9,90 101,98 6,83 4,32 0,03Caqueta 0,00 0,00 0,00 0,00 2,68Chocó 226,18 395,17 1.718,57 3.623,37 6.953,47Córdoba 2,09 2,02 63,06 107,15 1,01Guainía 0,48 0,68 0,56 0,13 0,01Huila 0,26 0,39 0,86 4,19 1,99Magdalena 162,20 0,00 0,00 0,00 0,00Nariño 11,85 18,00 12,93 30,25 8,07Putumayo 0,08 0,13 0,32 0,65 8,91Quindio 0,18 0,00 0,40 0,39 0,35Risaralda 11,13 9,36 14,34 11,18 11,38Santan<strong>de</strong>r 8,13 26,58 17,37 14,61 24,8370Tolima 112,31 96,05 79,04 102,32 42,41Valle <strong>de</strong>l Cauca 0,68 5,40 37,14 12,36 1,15Vaupes 0,00 0,00 0,06 0,26 0,02Otros* 198,61 48,12 0,00 0,00 0,01Total Nacional 9.764,71 9.161,55 10.826,98 15.300,37 24.045,12Fuente: SIMCO, Ingeominas <strong>2007</strong> a 2010 y Servicio Geológico Colombiano <strong>2011</strong>* En otros se incluyen Arauca, Boyacá, Cundinamarca, La Guajira, Guaviare, Meta, Sucre y VichadaElaboró: UPME, febrero <strong>de</strong> 2012Periodicidad Trimestral


