

BoletÃn EstadÃstico de Minas y EnergÃa 2007 - 2011 - simco
BoletÃn EstadÃstico de Minas y EnergÃa 2007 - 2011 - simco
BoletÃn EstadÃstico de Minas y EnergÃa 2007 - 2011 - simco

You also want an ePaper? Increase the reach of your titles
YUMPU automatically turns print PDFs into web optimized ePapers that Google loves.
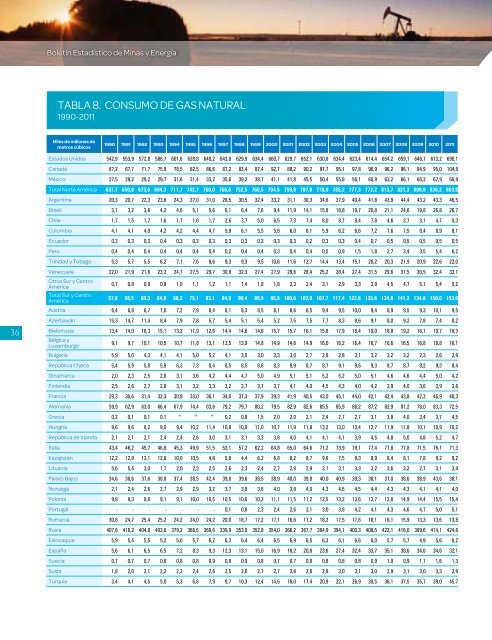
Boletín Estadístico <strong>de</strong> <strong>Minas</strong> y EnergíaTABLA 8. CONSUMO DE GAS NATURAL1990-<strong>2011</strong>Miles <strong>de</strong> millones <strong>de</strong>metros cúbicos1990 1991 1992 1993 1994 1995 1996 1997 1998 1999 2000 2001 2002 2003 2004 2005 2006 <strong>2007</strong> 2008 2009 2010 <strong>2011</strong>Estados Unidos 542,9 553,9 572,8 588,7 601,6 628,8 640,2 643,8 629,9 634,4 660,7 629,7 652,1 630,8 634,4 623,4 614,4 654,2 659,1 648,7 673,2 690,1Canadá 67,2 67,7 71,7 75,9 78,5 82,5 86,6 87,2 83,4 87,4 92,7 88,2 90,2 97,7 95,1 97,8 96,9 96,2 96,1 94,9 95,0 104,8México 27,5 29,2 29,2 29,7 31,6 31,4 33,2 35,6 39,2 38,7 41,1 41,8 45,5 50,4 55,8 56,1 60,9 63,2 66,1 66,2 67,9 68,9Total Norte América 637,7 650,8 673,6 694,3 711,7 742,7 760,0 766,6 752,5 760,5 794,5 759,8 787,8 778,9 785,2 777,3 772,2 813,7 821,3 809,9 836,2 863,8Argentina 20,3 20,7 22,3 23,6 24,3 27,0 31,0 28,5 30,5 32,4 33,2 31,1 30,3 34,6 37,9 40,4 41,8 43,9 44,4 43,2 43,3 46,5Brasil 3,1 3,2 3,6 4,2 4,6 5,1 5,6 6,1 6,4 7,6 9,4 11,9 14,1 15,8 18,8 19,7 20,8 21,1 24,6 19,8 26,8 26,7Chile 1,7 1,5 1,7 1,6 1,7 1,6 1,7 2,6 3,7 5,0 6,5 7,3 7,4 8,0 8,7 8,4 7,8 4,6 2,7 3,1 4,7 5,3Colombia 4,1 4,1 4,0 4,2 4,2 4,4 4,7 5,9 6,1 5,5 5,8 6,0 6,1 5,9 6,2 6,6 7,2 7,6 7,5 8,4 8,9 8,1Ecuador 0,3 0,3 0,3 0,4 0,3 0,3 0,3 0,3 0,3 0,3 0,3 0,3 0,2 0,3 0,3 0,4 0,7 0,5 0,5 0,5 0,5 0,5Peru 0,4 0,4 0,4 0,4 0,4 0,4 0,4 0,2 0,4 0,4 0,3 0,4 0,4 0,5 0,9 1,5 1,8 2,7 3,4 3,5 5,4 6,2Trinidad y Tobago 5,3 5,7 5,5 6,2 7,1 7,6 8,6 9,3 9,3 9,5 10,6 11,6 12,7 14,4 13,4 15,1 20,2 20,3 21,9 20,9 22,6 22,036Venezuela 22,0 21,9 21,6 23,3 24,7 27,5 29,7 30,8 32,3 27,4 27,9 29,6 28,4 25,2 28,4 27,4 31,5 29,6 31,5 30,5 32,4 33,1Otros Sur y CentroAmérica0,7 0,8 0,9 0,9 1,0 1,1 1,2 1,1 1,4 1,8 1,8 2,3 2,4 3,1 2,9 3,3 3,9 4,5 4,7 5,1 5,4 5,2Total Sur y CentroAmérica57,8 58,5 60,3 64,8 68,2 75,1 83,1 84,9 90,4 89,9 95,9 100,6 102,0 107,7 117,4 122,8 135,6 134,8 141,2 134,8 150,0 153,6Austria 6,4 6,8 6,7 7,0 7,2 7,9 8,4 8,1 8,3 8,5 8,1 8,6 8,5 9,4 9,5 10,0 9,4 8,9 9,5 9,3 10,1 9,5Azerbaiyán 15,3 14,7 11,4 8,4 7,9 7,8 5,7 5,4 5,1 5,4 5,2 7,5 7,5 7,7 8,3 8,6 9,1 8,0 9,2 7,8 7,4 8,2Bielorrusia 13,4 14,0 16,3 15,1 13,2 11,9 12,6 14,4 14,6 14,8 15,7 15,7 16,1 15,8 17,9 18,4 19,0 18,8 19,2 16,1 19,7 18,3Bélgica yLuxemburgo9,1 9,7 10,1 10,5 10,7 11,8 13,1 12,5 13,9 14,8 14,9 14,6 14,9 16,0 16,2 16,4 16,7 16,6 16,5 16,8 18,8 16,1Bulgaria 5,9 5,0 4,3 4,1 4,1 5,0 5,2 4,1 3,5 3,0 3,3 3,0 2,7 2,8 2,8 3,1 3,2 3,2 3,2 2,3 2,6 2,9República Checa 5,4 5,9 5,8 5,9 6,3 7,3 8,4 8,5 8,5 8,6 8,3 8,9 8,7 8,7 9,1 9,6 9,3 8,7 8,7 8,2 9,3 8,4Dinamarca 2,0 2,3 2,5 2,8 3,1 3,6 4,2 4,4 4,7 5,0 4,9 5,1 5,1 5,2 5,2 5,0 5,1 4,6 4,6 4,4 5,0 4,2Finlandia 2,5 2,6 2,7 2,8 3,1 3,2 3,3 3,2 3,7 3,7 3,7 4,1 4,0 4,5 4,3 4,0 4,2 3,9 4,0 3,6 3,9 3,6Francia 29,3 30,6 31,4 32,3 30,9 33,0 36,1 34,6 37,3 37,9 39,3 41,9 40,5 43,0 45,1 44,0 42,1 42,4 43,8 42,2 46,9 40,3Alemania 59,9 62,9 63,0 66,4 67,9 74,4 83,6 79,2 79,7 80,2 79,5 82,9 82,6 85,5 85,9 86,2 87,2 82,9 81,2 78,0 83,3 72,5Grecia 0,2 0,1 0,1 0,1 ^ ^ ^ 0,2 0,8 1,5 2,0 2,0 2,1 2,4 2,7 2,7 3,1 3,8 4,0 3,4 3,7 4,5Hungría 9,6 9,6 8,2 9,0 9,4 10,2 11,4 10,8 10,9 11,0 10,7 11,9 11,8 13,2 13,0 13,4 12,7 11,9 11,8 10,1 10,9 10,2República <strong>de</strong> Irlanda 2,1 2,1 2,1 2,4 2,4 2,6 3,0 3,1 3,1 3,3 3,8 4,0 4,1 4,1 4,1 3,9 4,5 4,8 5,0 4,8 5,2 4,7Italia 43,4 46,2 45,7 46,8 45,3 49,9 51,5 53,1 57,2 62,2 64,8 65,0 64,6 71,2 73,9 79,1 77,4 77,8 77,8 71,5 76,1 71,3Kazajistán 12,2 12,8 13,1 12,6 10,0 10,5 4,8 5,8 4,4 6,2 6,8 8,2 8,7 9,6 7,5 9,3 9,9 8,4 8,1 7,8 8,2 9,2Lituania 5,6 5,4 3,0 1,7 2,0 2,3 2,5 2,6 2,3 2,4 2,7 2,8 2,9 3,1 3,1 3,3 3,2 3,6 3,2 2,7 3,1 3,4Paises Bajos 34,6 38,6 37,6 38,8 37,4 38,5 42,4 39,8 39,6 38,5 38,9 40,0 39,8 40,0 40,9 39,3 38,1 37,0 38,6 38,9 43,6 38,1Noruega 2,1 2,4 2,6 2,7 2,9 2,9 3,2 3,7 3,8 3,6 4,0 3,8 4,0 4,3 4,6 4,5 4,4 4,3 4,3 4,1 4,1 4,0Polonia 9,9 9,3 8,6 9,1 9,1 10,0 10,5 10,5 10,6 10,3 11,1 11,5 11,2 12,5 13,2 13,6 13,7 13,8 14,9 14,4 15,5 15,4Portugal - - - - - - - 0,1 0,8 2,3 2,4 2,6 3,1 3,0 3,8 4,2 4,1 4,3 4,6 4,7 5,0 5,1Rumania 30,8 24,7 25,4 25,2 24,2 24,0 24,2 20,0 18,7 17,2 17,1 16,6 17,2 18,3 17,5 17,6 18,1 16,1 15,9 13,3 13,6 13,8Rusia 407,6 418,2 404,8 403,6 379,2 366,5 368,6 339,9 353,8 352,8 354,0 366,2 367,7 384,9 394,1 400,3 408,5 422,1 416,0 389,6 414,1 424,6Eslovaquia 5,9 5,4 5,5 5,2 5,0 5,7 6,2 6,3 6,4 6,4 6,5 6,9 6,5 6,3 6,1 6,6 6,0 5,7 5,7 4,9 5,6 6,2España 5,6 6,1 6,5 6,5 7,2 8,3 9,3 12,3 13,1 15,0 16,9 18,2 20,8 23,6 27,4 32,4 33,7 35,1 38,6 34,6 34,6 32,1Suecia 0,7 0,7 0,7 0,8 0,8 0,8 0,9 0,8 0,9 0,8 0,7 0,7 0,8 0,8 0,8 0,8 0,9 1,0 0,9 1,1 1,6 1,3Suiza 1,8 2,0 2,1 2,2 2,2 2,4 2,6 2,5 2,6 2,7 2,7 2,8 2,8 2,9 3,0 3,1 3,0 2,9 3,1 3,0 3,3 2,9Turquia 3,4 4,1 4,5 5,0 5,3 6,8 7,9 9,7 10,3 12,4 14,6 16,0 17,4 20,9 22,1 26,9 30,5 36,1 37,5 35,7 39,0 45,7


