

BoletÃn EstadÃstico de Minas y EnergÃa 2007 - 2011 - simco
BoletÃn EstadÃstico de Minas y EnergÃa 2007 - 2011 - simco
BoletÃn EstadÃstico de Minas y EnergÃa 2007 - 2011 - simco

Create successful ePaper yourself
Turn your PDF publications into a flip-book with our unique Google optimized e-Paper software.
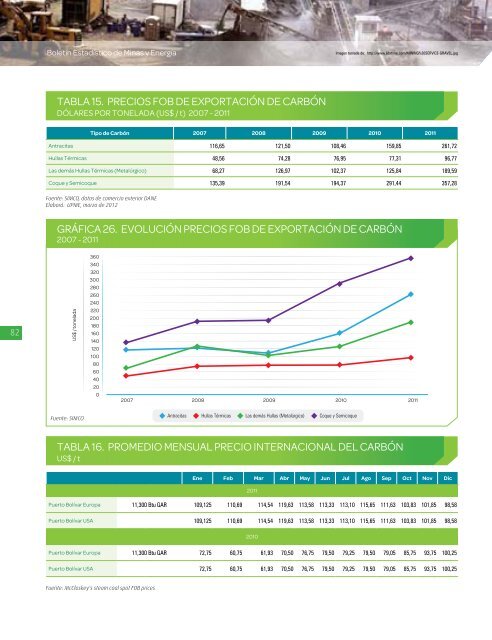
Boletín Estadístico <strong>de</strong> <strong>Minas</strong> y EnergíaImagen tomada <strong>de</strong>: http://www.lidstone.com/MINING%20SERVICE-GRAVEL.jpgTABLA 15. PRECIOS FOB DE EXPORTACIÓN DE CARBÓNDÓLARES POR TONELADA (US$ / t) <strong>2007</strong> - <strong>2011</strong>Tipo <strong>de</strong> Carbón <strong>2007</strong> 2008 2009 2010 <strong>2011</strong>Antracitas 116,65 121,50 108,46 159,85 261,72Hullas Térmicas 48,56 74,28 76,95 77,31 96,77Las <strong>de</strong>más Hullas Térmicas (Metalúrgico) 68,27 126,97 102,37 125,84 189,59Coque y Semicoque 135,39 191,54 194,37 291,44 357,28Fuente: SIMCO, datos <strong>de</strong> comercio exterior DANEElaboró: UPME, marzo <strong>de</strong> 2012GRÁFICA 26. EVOLUCIÓN PRECIOS FOB DE EXPORTACIÓN DE CARBÓN<strong>2007</strong> - <strong>2011</strong>82US$ / tonelada360340320300280260240220200180160140120100806040200<strong>2007</strong> 2008 2009 2010 <strong>2011</strong>Fuente: SIMCO.Antracitas Hullas Térmicas Las <strong>de</strong>más Hullas (Metalúrgico) Coque y SemicoqueTABLA 16. PROMEDIO MENSUAL PRECIO INTERNACIONAL DEL CARBÓNUS$ / tEne Feb Mar Abr May Jun Jul Ago Sep Oct Nov Dic<strong>2011</strong>Puerto Bolívar Europa 11,300 Btu GAR 109,125 110,69 114,54 119,63 113,58 113,33 113,10 115,65 111,63 103,83 101,85 98,58Puerto Bolívar USA 109,125 110,69 114,54 119,63 113,58 113,33 113,10 115,65 111,63 103,83 101,85 98,582010Puerto Bolívar Europa 11,300 Btu GAR 72,75 60,75 61,93 70,50 76,75 79,50 79,25 79,50 79,05 85,75 93,75 100,25Puerto Bolívar USA 72,75 60,75 61,93 70,50 76,75 79,50 79,25 79,50 79,05 85,75 93,75 100,25Fuente: McCloskey's steam coal spot FOB prices


