

BoletÃn EstadÃstico de Minas y EnergÃa 2007 - 2011 - simco
BoletÃn EstadÃstico de Minas y EnergÃa 2007 - 2011 - simco
BoletÃn EstadÃstico de Minas y EnergÃa 2007 - 2011 - simco

Create successful ePaper yourself
Turn your PDF publications into a flip-book with our unique Google optimized e-Paper software.
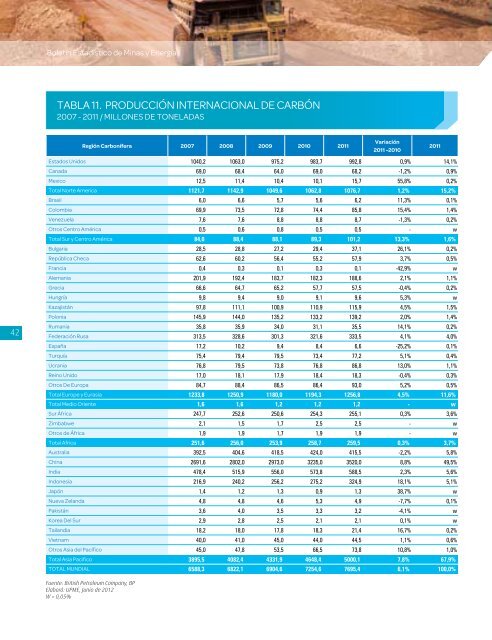
Boletín Estadístico <strong>de</strong> <strong>Minas</strong> y EnergíaTABLA 11. PRODUCCIÓN INTERNACIONAL DE CARBÓN<strong>2007</strong> - <strong>2011</strong> / MILLONES DE TONELADASRegión Carbonífera <strong>2007</strong> 2008 2009 2010 <strong>2011</strong>Variación<strong>2011</strong> -2010<strong>2011</strong>42Estados Unidos 1040,2 1063,0 975,2 983,7 992,8 0,9% 14,1%Canada 69,0 68,4 64,0 69,0 68,2 -1,2% 0,9%Mexico 12,5 11,4 10,4 10,1 15,7 55,8% 0,2%Total Norte America 1121,7 1142,9 1049,6 1062,8 1076,7 1,2% 15,2%Brasil 6,0 6,6 5,7 5,6 6,2 11,3% 0,1%Colombia 69,9 73,5 72,8 74,4 85,8 15,4% 1,4%Venezuela 7,6 7,6 8,8 8,8 8,7 -1,3% 0,2%Otros Centro América 0,5 0,6 0,8 0,5 0,5 - wTotal Sur y Centro América 84,0 88,4 88,1 89,3 101,2 13,3% 1,6%Bulgaria 28,5 28,8 27,2 29,4 37,1 26,1% 0,2%República Checa 62,6 60,2 56,4 55,2 57,9 3,7% 0,5%Francia 0,4 0,3 0,1 0,3 0,1 -42,9% wAlemania 201,9 192,4 183,7 182,3 188,6 2,1% 1,1%Grecia 66,6 64,7 65,2 57,7 57,5 -0,4% 0,2%Hungría 9,8 9,4 9,0 9,1 9,6 5,3% wKazajistán 97,8 111,1 100,9 110,9 115,9 4,5% 1,5%Polonia 145,9 144,0 135,2 133,2 139,2 2,0% 1,4%Rumania 35,8 35,9 34,0 31,1 35,5 14,1% 0,2%Fe<strong>de</strong>ración Rusa 313,5 328,6 301,3 321,6 333,5 4,1% 4,0%España 17,2 10,2 9,4 8,4 6,6 -25,2% 0,1%Turquía 75,4 79,4 79,5 73,4 77,2 5,1% 0,4%Ucrania 76,8 79,5 73,8 76,8 86,8 13,0% 1,1%Reino Unido 17,0 18,1 17,9 18,4 18,3 -0,4% 0,3%Otros De Europa 84,7 88,4 86,5 86,4 93,0 5,2% 0,5%Total Europe y Eurasia 1233,8 1250,9 1180,0 1194,3 1256,8 4,5% 11,6%Total Medio Oriente 1,6 1,6 1,2 1,2 1,2 - wSur África 247,7 252,6 250,6 254,3 255,1 0,3% 3,6%Zimbabwe 2,1 1,5 1,7 2,5 2,5 - wOtros <strong>de</strong> África 1,9 1,9 1,7 1,9 1,9 - wTotal Africa 251,6 256,0 253,9 258,7 259,5 0,3% 3,7%Australia 392,5 404,6 418,5 424,0 415,5 -2,2% 5,8%China 2691,6 2802,0 2973,0 3235,0 3520,0 8,8% 49,5%India 478,4 515,9 556,0 573,8 588,5 2,3% 5,6%Indonesia 216,9 240,2 256,2 275,2 324,9 18,1% 5,1%Japón 1,4 1,2 1,3 0,9 1,3 38,7% wNueva Zelanda 4,8 4,8 4,6 5,3 4,9 -7,7% 0,1%Pakistán 3,6 4,0 3,5 3,3 3,2 -4,1% wKorea Del Sur 2,9 2,8 2,5 2,1 2,1 0,1% wTailandia 18,2 18,0 17,8 18,3 21,4 16,7% 0,2%Vietnam 40,0 41,0 45,0 44,0 44,5 1,1% 0,6%Otros Asia <strong>de</strong>l Pacífico 45,0 47,8 53,5 66,5 73,8 10,8% 1,0%Total Asia Pacifico 3895,5 4082,4 4331,9 4648,4 5000,1 7,8% 67,9%TOTAL MUNDIAL 6588,3 6822,1 6904,6 7254,6 7695,4 6,1% 100,0%Fuente: British Petroleum Company, BPElaboró: UPME, Junio <strong>de</strong> 2012W = 0,05%


