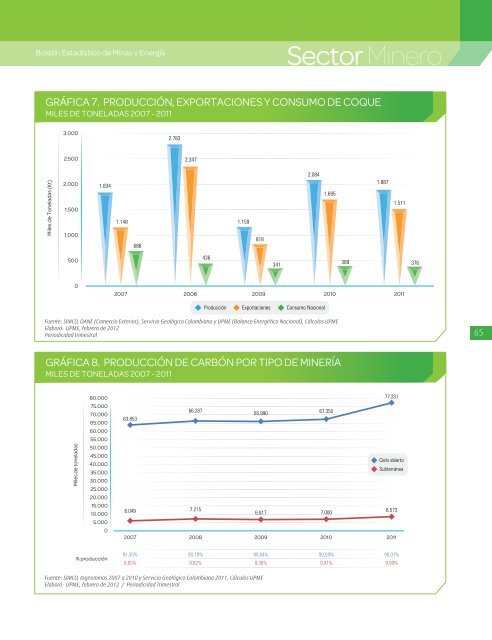
Boletín Estadístico <strong>de</strong> <strong>Minas</strong> y EnergíaSector MineroGRÁFICA 7. PRODUCCIÓN, EXPORTACIONES Y CONSUMO DE COQUEMILES DE TONELADAS <strong>2007</strong> - <strong>2011</strong>3.0002.7832.5002.347Miles <strong>de</strong> Toneladas (Kt)2.0001.5001.0001.8341.1486861.1598182.0841.6951.8871.511500436341389 3760<strong>2007</strong> 2008 2009 2010 <strong>2011</strong>Producción Exportaciones Consumo NacionalFuente: SIMCO, DANE (Comercio Exterior), Servicio Geológico Colombiano y UPME (Balance Energético Nacional), Cálculos UPMEElaboró: UPME, febrero <strong>de</strong> 2012Periodicidad trimestral65GRÁFICA 8. PRODUCCIÓN DE CARBÓN POR TIPO DE MINERÍAMILES DE TONELADAS <strong>2007</strong> - <strong>2011</strong>Miles <strong>de</strong> toneladas80.00075.00070.00065.00060.00055.00050.00045.00040.00035.00030.00025.00020.00015.00010.0005.000077.23166.28765.990 67.35063.853Cielo abiertoSubterránea6.049 7.2156.817 7.0008.573<strong>2007</strong> 2008 2009 2010 <strong>2011</strong>% producción91,35% 90,18% 90,64% 90,59% 90,01%8,65% 9,82% 9,36% 9,41% 9,99%Fuente: SIMCO, Ingeominas <strong>2007</strong> a 2010 y Servicio Geológico Colombiano <strong>2011</strong>, Cálculos UPMEElaboró: UPME, febrero <strong>de</strong> 2012 / Periodicidad Trimestral
Boletín Estadístico <strong>de</strong> <strong>Minas</strong> y EnergíaImagen tomada <strong>de</strong>: http://www.lidstone.com/MINING%20SERVICE-GRAVEL.jpgTABLA 4. PRODUCCIÓN DE CARBÓN POR EMPRESAMILES DE TONELADAS <strong>2007</strong> - <strong>2011</strong>Zona carbonífera Proyectos <strong>2007</strong> 2008 2009 2010 <strong>2011</strong>CERREJON ZONA NORTE 19.002,20 17.982,94 15.881,74 15.353,44 16.499,03CONSORCIO CERREJON - AREA PATILLA 5.488,48 4.535,55 5.287,91 5.622,65 4.660,74La GuajiraCARBONES COLOMBIANOS DEL CERREJON - AREA LA COMUNIDAD 733,94 1.095,48 1.178,20 1.227,05 1.397,67CARBONES DEL CERREJON - AREA LA COMUNIDAD 2.797,64 4.161,30 4.404,91 5.178,00 5.996,54CARBONES DEL CERREJON - AREA OREGANAL 2.047,19 4.164,59 4.678,16 3.717,11 4.801,63Total La Guajira TOTAL GUAJIRA 30.069,45 31.939,86 31.430,93 31.098,25 33.355,61DRUMMOND LTD - AREA LA LOMA 22.898,18 21.396,55 18.431,53 18.072,85 18.115,61DRUMMOND LTD - EL DESCANSO 0,00 0,00 2.157,78 2.951,53 4.925,91CARBONES DEL TESORO S.A. 1.209,73 1.849,48 1.317,93 1.415,50 1.167,26CARBONES DE LA JAGUA 2.625,17 2.517,10 2.667,54 1.572,88 2.994,01CONSORCIO MINERO UNIDO S.A. 551,69 0,00 801,26 1.753,16 2.844,5666CesarC.I. PRODECO S.A. 3.725,15 4.697,69 5.700,06 5.233,78 7.380,12COMPAÑÍA CARBONES DEL CESAR S.A. COLOMBIA NATIONAL RESOURCES- CNR1.461,58 1.299,23 1.045,06 1.516,26 2.391,24NORCARBON S.A. - AREA LA DIVISA 389,46 356,04 306,72 508,58 298,04VALE COAL COLOMBIA LTD - DIAMOND LTDA-EMCARBON S.A -CARIBE 0,00 1.560,09 1.622,23 2.990,99 3.570,81CARBOANDES S.A. 325,61 0,00 0,00 0,00Total Cesar TOTAL CESAR 33.186,57 33.676,18 34.050,11 36.015,53 43.687,56Total Córdoba CARBONES DEL CARIBE - AREA LA GUACAMAYA 480,96 493,16 392,32 100,44 311,83ANTIOQUIA 230,13 403,92 655,80 149,37 334,01BOYACA 2.275,22 2.230,95 2.276,23 2.675,94 2.753,96CASANARE 0,12 0,06 0,57 0,45 0,54Interior <strong>de</strong>l PaísCAUCA 17,88 9,93 4,92 0,99 83,80CUNDINAMARCA 1.784,74 2.405,64 1.941,59 2.056,11 3.063,22SANTANDER 116,29 178,13 116,53 135,90 201,98NORTE DE SANTANDER 1.691,29 2.085,19 1.938,40 2.117,16 1.901,93VALLE DEL CAUCA 49,56 79,05 0,00 108,79Total Interior 6.165,22 7.392,87 6.934,05 7.135,92 8.448,23Total Nacional 69.902 73.502 72.807 74.350 85.803Fuente: SIMCO, Ingeominas <strong>2007</strong> a 2010 y Servicio Geológico Colombiano <strong>2011</strong>Elaboró: UPME, febrero <strong>de</strong> 2012Periodicidad Trimestral