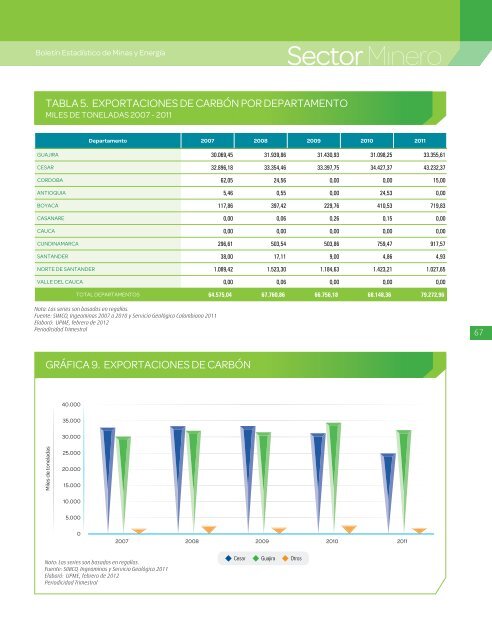
Boletín Estadístico <strong>de</strong> <strong>Minas</strong> y EnergíaSector MineroTABLA 5. EXPORTACIONES DE CARBÓN POR DEPARTAMENTOMILES DE TONELADAS <strong>2007</strong> - <strong>2011</strong>Departamento <strong>2007</strong> 2008 2009 2010 <strong>2011</strong>GUAJIRA 30.069,45 31.939,86 31.430,93 31.098,25 33.355,61CESAR 32.896,18 33.354,46 33.397,75 34.427,37 43.232,37CORDOBA 62,05 24,56 0,00 0,00 15,00ANTIOQUIA 5,46 0,55 0,00 24,53 0,00BOYACA 117,86 397,42 229,76 410,53 719,83CASANARE 0,00 0,06 0,26 0,15 0,00CAUCA 0,00 0,00 0,00 0,00 0,00CUNDINAMARCA 296,61 503,54 503,86 759,47 917,57SANTANDER 38,00 17,11 9,00 4,86 4,93NORTE DE SANTANDER 1.089,42 1.523,30 1.184,63 1.423,21 1.027,65VALLE DEL CAUCA 0,00 0,06 0,00 0,00 0,00TOTAL DEPARTAMENTOS 64.575,04 67.760,86 66.756,18 68.148,36 79.272,96Nota: Las series son basados en regalías.Fuente: SIMCO, Ingeominas <strong>2007</strong> a 2010 y Servicio Geológico Colombiano <strong>2011</strong>Elaboró: UPME, febrero <strong>de</strong> 2012Periodicidad Trimestral67GRÁFICA 9. EXPORTACIONES DE CARBÓN40.00035.00030.000Miles <strong>de</strong> toneladas25.00020.00015.00010.0005.0000<strong>2007</strong> 2008 2009 2010 <strong>2011</strong>Nota: Las series son basados en regalías.Fuente: SIMCO, Ingeominas y Servicio Geológico <strong>2011</strong>Elaboró: UPME, febrero <strong>de</strong> 2012Periodicidad TrimestralCesar Guajira Otros
Boletín Estadístico <strong>de</strong> <strong>Minas</strong> y EnergíaImagen tomada <strong>de</strong>: http://www.lidstone.com/MINING%20SERVICE-GRAVEL.jpgGRÁFICA 10. EXPORTACIONES DE CARBÓN OTROS DEPARTAMENTOS1.6001.4001.200Miles <strong>de</strong> toneladas1.0008006004002000<strong>2007</strong> 2008 2009 2010 <strong>2011</strong>Norte De Santan<strong>de</strong>r Cundinamarca Boyaca Santan<strong>de</strong>r Casanare Cordoba Valle Del Cauca AntioquiaNota: Las series son basados en regalías.. Fuente: SIMCO, Ingeominas y Servicio Geológico <strong>2011</strong>. Elaboró: UPME, febrero <strong>de</strong> 2012. Periodicidad Trimestral68TABLA 6. PRODUCCIÓN DE ORO POR DEPARTAMENTOKILOGRAMOS <strong>2007</strong> - <strong>2011</strong>Departamento <strong>2007</strong> 2008 2009 2010 <strong>2011</strong>Amazonas 0,26 1,00 0,00 0,00 0,66Antioquia 11.414,18 25.995,60 28.027,85 18.898,47 19.156,33Bolívar 417,27 2.389,82 3.431,14 5.763,72 5.423,03Caldas 1.120,85 1.080,28 1.217,53 1.200,49 1.273,08Caquetá 0,09 0,54 0,18 3,08 3,21Cauca 350,69 621,54 2.316,77 1.036,72 1.127,57Chocó 1.589,95 3.340,44 10.847,19 24.529,71 27.915,13Córdoba 14,26 82,02 454,79 638,22 69,18Cundinamarca 0,00 0,00 0,69 0,00 0,00Guanía 4,65 14,50 5,52 22,43 29,71Huila 3,67 4,81 22,28 43,55 0,00Magdalena 0,00 8,24 4,59 0,42 0,06Nariño 199,57 238,67 442,66 328,83 235,77Putumayo 1,20 7,31 15,92 13,38 73,73Quindio 1,27 7,96 14,69 20,67 1,73Risaralda 24,67 30,05 43,75 35,24 35,99Santan<strong>de</strong>r 35,97 61,97 140,07 53,83 60,36Tolima 255,15 217,25 275,80 483,06 268,90Valle <strong>de</strong>l Cauca 47,00 203,08 569,99 522,04 200,57Vaupés 0,48 0,37 4,00 7,98 0,64Otros* 0,38 15,58 2,37 3,82 32,19Total Nacional 15.481,55 34.321,02 47.837,77 53.605,66 55.907,84* En otros se incluyen Arauca, Atlantico, Boyacá, Cesar, Cundinamarca, La Guajira, Guaviare, Meta, Norte <strong>de</strong> Santan<strong>de</strong>r, Sucre y VichadaFuente: SIMCO, Ingeominas <strong>2007</strong> a 2010 y Servicio Geológico Colombiano <strong>2011</strong>. Elaboró: UPME, febrero <strong>de</strong> 2012 / Periodicidad Trimestral