Boletín Estadístico <strong>de</strong> <strong>Minas</strong> y EnergíaSector HidrocarburosTABLA 4. VOLUMEN DE LAS EXPORTACIONES DE PETRÓLEO<strong>2007</strong> - <strong>2011</strong> Miles <strong>de</strong> Barriles por día calendarioMes <strong>2007</strong> 2008 2009 2010 <strong>2011</strong>*Enero 243,74 197,96 324,48 401,77 436,26Febrero 187,20 260,48 305,19 432,52 521,09Marzo 251,86 259,03 290,05 362,52 630,26Abril 216,66 252,31 327,70 499,71 499,76Mayo 226,08 259,05 333,85 405,36 548,41Junio 347,78 247,90 321,82 433,08 547,39Julio 232,68 231,18 385,63 463,34 600,07Agosto 181,30 307,19 385,98 451,14 558,76Septiembre 282,12 302,54 347,33 460,49 485,86Octubre 219,55 350,85 382,36 499,75 643,98Noviembre 266,24 328,45 398,11 468,02 554,71Diciembre 253,43 299,56 402,87 447,24 673,78Total 242,45 274,70 350,84 443,60 559,07169GRÁFICA 5. VOLUMEN DE LAS EXPORTACIONES DE PETRÓLEO<strong>2007</strong> - <strong>2011</strong> Miles <strong>de</strong> Barriles por día calendario600,00500,00400,00Miles BPDC300,00200,00100,000,00<strong>2007</strong> 2008 2009 2010 <strong>2011</strong>*
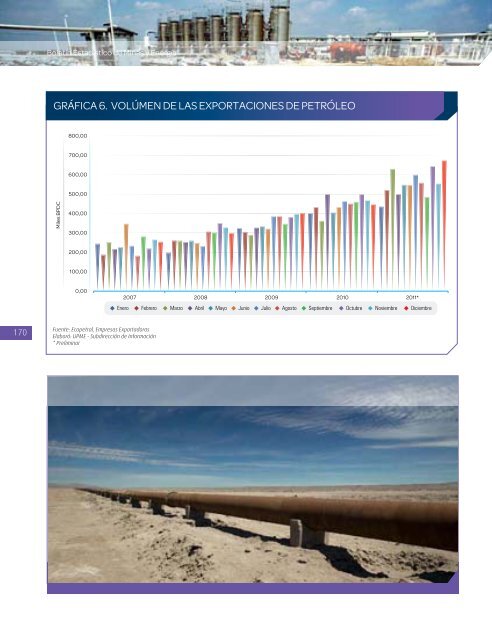
Boletín Estadístico <strong>de</strong> <strong>Minas</strong> y EnergíaGRÁFICA 6. VOLÚMEN DE LAS EXPORTACIONES DE PETRÓLEO800,00700,00600,00500,00Miles BPDC400,00300,00200,00100,000,00<strong>2007</strong> 2008 2009 2010 <strong>2011</strong>*Enero Febrero Marzo Abril Mayo Junio Julio Agosto Septiembre Octubre Noviembre Diciembre170Fuente: Ecopetrol, Empresas ExportadorasElaboró: UPME - Subdirección <strong>de</strong> Información* Preliminar