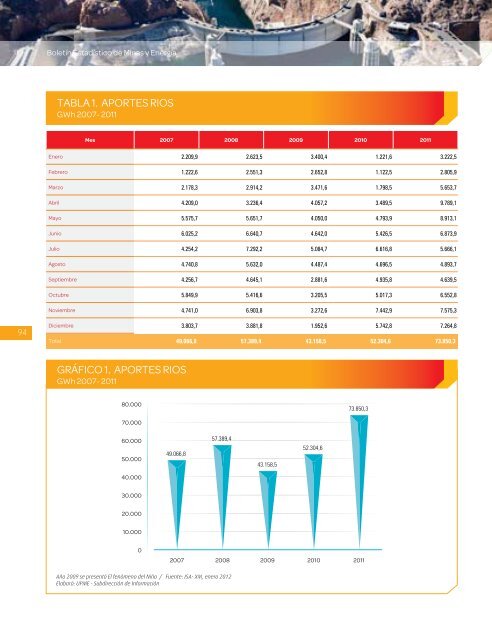
Boletín Estadístico <strong>de</strong> <strong>Minas</strong> y EnergíaSector EléctricoLa intensidad <strong>de</strong> este fenómeno ocasionó la ocurrencia <strong>de</strong> precipitaciones excesivassobre el territorio nacional, el cual hizo que los aportes hidrológicos durante <strong>2011</strong> fueransuperiores a los <strong>de</strong> un año promedio, en un 39%. Es así que ya en septiembre <strong>de</strong> <strong>2011</strong>, losaportes habían alcanzado el acumulado <strong>de</strong> un año promedio.El análisis <strong>de</strong>l fenómeno <strong>de</strong> La Niña muestra que los caudales <strong>de</strong> la región Centro durantetodo el año <strong>2011</strong>, estuvieron por encima <strong>de</strong>l año más húmedo en sus registros históricos. Alfinalizar diciembre <strong>de</strong> <strong>2011</strong>, el acumulado en esta región fue superior al promedio en el 116%,es <strong>de</strong>cir más <strong>de</strong>l doble <strong>de</strong> lo que se presentaría en un año con caudales medios, siendo<strong>2011</strong>, el año más húmedo <strong>de</strong> esta serie, los aportes presentados que superaron los registroshistóricos promedios, las reservas al finalizar el año alcanzaron el 88,82%, los aportes <strong>de</strong>los diferentes ríos fueron <strong>de</strong> 73.850 GWh, siendo el más alto valor en los últimos 5 años.La capacidad efectiva <strong>de</strong> generación en Colombia en los últimos 5 años ha tenido unincremento <strong>de</strong>l 8%, al pasar en el año <strong>2007</strong> <strong>de</strong> 13.410 MW a 14.424 MW en el año <strong>2011</strong>, laGeneración Real <strong>de</strong> Energía Eléctrica ha tenido un crecimiento <strong>de</strong>l 9% al pasar en el año<strong>2007</strong> <strong>de</strong> 53.665,7 a 58.628,7 durante el año <strong>2011</strong>.Como se pue<strong>de</strong> ver en la tabla No. 11, los agentes que participaron con la mayor generación<strong>de</strong> energía eléctrica durante el año <strong>2011</strong> fueron EPM, EMGESA e ISAGEN. Adicionalmente, seobserva que la generación eléctrica ha aumentado en un 9,25% comparando el año <strong>2007</strong>con el año <strong>2011</strong>.En lo relacionado al consumo <strong>de</strong> combustibles para generación eléctrica, el gas presentóun incremento <strong>de</strong>l 80%, al comparar los años <strong>2007</strong> - 2010 y <strong>de</strong>l 43%, para los años <strong>2011</strong> y2010, <strong>de</strong>bido al Fenómeno <strong>de</strong>l Niño, tal como se observa en la gráfica No. 10.93La <strong>de</strong>manda máxima <strong>de</strong> potencia se presentó durante estos últimos cinco años en elmes <strong>de</strong> noviembre <strong>de</strong>l año <strong>2011</strong>, por un valor <strong>de</strong> 9.295 MW. La <strong>de</strong>manda <strong>de</strong>l SIN <strong>de</strong> energíaeléctrica en Colombia en el <strong>2011</strong> alcanzó los 57.150,3 GWh, con un crecimiento <strong>de</strong> 4.296,9GWh, equivalente al 8%.La <strong>de</strong>manda comercial regulada ha tenido un aumento <strong>de</strong> 7,92% en los últimos cinco añosy la <strong>de</strong>manda comercial no regulada registra un aumento <strong>de</strong>l 8,47% en este mismo período.Durante <strong>2011</strong>, se realizaron intercambios <strong>de</strong> energía con Ecuador y Venezuela, exportándosehacia Ecuador un total <strong>de</strong> 1.294,3 GWh, valor superior en un 48% frente al registrado en el<strong>2007</strong> (876,69 GWh).El precio promedio en bolsa <strong>de</strong> energía eléctrica aumento 9%, al comparar el año <strong>2011</strong> conel <strong>2007</strong> y 41,6% <strong>de</strong>l año 2010 al <strong>2011</strong>. El precio promedio en contrato <strong>de</strong> energía eléctricaaumento el 53%, al comparar el año <strong>2011</strong> con el <strong>2007</strong> y el 7,6% <strong>de</strong>l año 2010 al <strong>2011</strong>.En lo que respecta a las líneas <strong>de</strong> transmisión, los circuitos sencillos a 500 kV hanaumentado en los últimos cinco años en 901 (km), con los proyectos Primavera Bacatá 197,Primavera- Ocaña 247, Ocaña – Copey 241 y Copey- Bolívar 167, entre otros, en <strong>de</strong>sarrollo<strong>de</strong> las convocatorias <strong>de</strong> la UPME.
Boletín Estadístico <strong>de</strong> <strong>Minas</strong> y EnergíaTABLA 1. APORTES RIOSGWh <strong>2007</strong>- <strong>2011</strong>Mes <strong>2007</strong> 2008 2009 2010 <strong>2011</strong>Enero 2.209,9 2.623,5 3.400,4 1.221,6 3.222,5Febrero 1.222,6 2.551,3 2.652,8 1.122,5 2.805,9Marzo 2.178,3 2.914,2 3.471,6 1.798,5 5.653,7Abril 4.209,0 3.236,4 4.057,2 3.489,5 9.789,1Mayo 5.575,7 5.651,7 4.050,0 4.793,9 8.913,1Junio 6.025,2 6.640,7 4.642,0 5.426,5 6.873,9Julio 4.254,2 7.292,2 5.084,7 6.616,8 5.666,1Agosto 4.740,8 5.632,0 4.487,4 4.696,5 4.893,7Septiembre 4.256,7 4.645,1 2.881,6 4.935,8 4.639,5Octubre 5.849,9 5.416,6 3.205,5 5.017,3 6.552,8Noviembre 4.741,0 6.903,8 3.272,6 7.442,9 7.575,394Diciembre 3.803,7 3.881,8 1.952,6 5.742,8 7.264,8Total 49.066,8 57.389,4 43.158,5 52.304,6 73.850,3GRÁFICO 1. APORTES RIOSGWh <strong>2007</strong>- <strong>2011</strong>80.00073.850,370.00060.00050.00049.066,857.389,443.158,552.304,640.00030.00020.00010.0000<strong>2007</strong> 2008 2009 2010 <strong>2011</strong>Año 2009 se presentó El fenómeno <strong>de</strong>l Niño / Fuente: ISA- XM, enero 2012Elaboró: UPME - Subdirección <strong>de</strong> Información