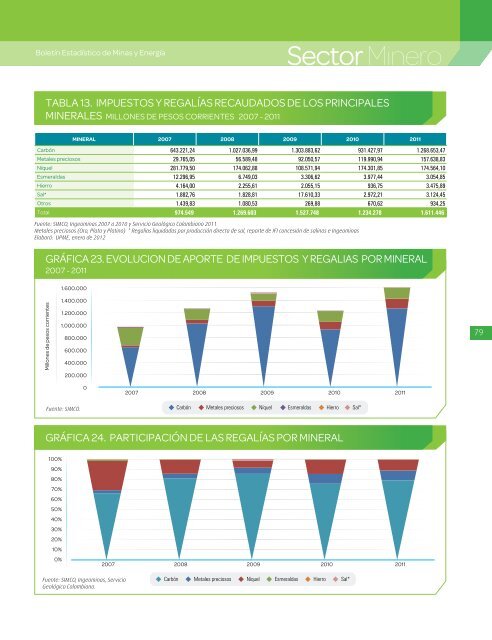
Boletín Estadístico <strong>de</strong> <strong>Minas</strong> y EnergíaSector MineroTABLA 13. IMPUESTOS Y REGALÍAS RECAUDADOS DE LOS PRINCIPALESMINERALES MILLONES DE PESOS CORRIENTES <strong>2007</strong> - <strong>2011</strong>MINERAL <strong>2007</strong> 2008 2009 2010 <strong>2011</strong>Carbón 643.221,24 1.027.036,99 1.303.883,62 931.427,97 1.268.653,47Metales preciosos 29.765,05 56.589,48 92.050,57 119.990,94 157.638,83Níquel 281.779,50 174.062,88 108.571,94 174.301,85 174.564,10Esmeraldas 12.296,95 6.749,03 3.306,62 3.977,44 3.054,85Hierro 4.164,00 2.255,61 2.055,15 936,75 3.475,89Sal* 1.882,76 1.828,81 17.610,33 2.972,21 3.124,45Otros 1.439,83 1.080,53 269,88 670,62 934,25Total 974.549 1.269.603 1.527.748 1.234.278 1.611.446Fuente: SIMCO, Ingeominas <strong>2007</strong> a 2010 y Servicio Geológico Colombiano <strong>2011</strong>Metales preciosos (Oro, Plata y Platino) * Regalias liquidadas por producción directa <strong>de</strong> sal, reporte <strong>de</strong> IFI concesión <strong>de</strong> salinas e IngeominasElaboró: UPME, enero <strong>de</strong> 2012GRÁFICA 23. EVOLUCION DE APORTE DE IMPUESTOS Y REGALIAS POR MINERAL<strong>2007</strong> - <strong>2011</strong>1.600.000Millones <strong>de</strong> pesos corrientes1.400.0001.200.0001.000.000800.000600.000400.000200.000790<strong>2007</strong> 2008 2009 2010 <strong>2011</strong>Fuente: SIMCO.CarbónMetales preciososNíquelEsmeraldasHierroSal*GRÁFICA 24. PARTICIPACIÓN DE LAS REGALÍAS POR MINERAL100%90%80%70%60%50%40%30%20%10%0%<strong>2007</strong> 2008 2009 2010 <strong>2011</strong>Fuente: SIMCO, Ingeominas, ServicioGeológico Colombiano.Carbón Metales preciosos Níquel Esmeraldas Hierro Sal*
Boletín Estadístico <strong>de</strong> <strong>Minas</strong> y EnergíaImagen tomada <strong>de</strong>: http://www.lidstone.com/MINING%20SERVICE-GRAVEL.jpgTABLA 14. PRECIOS INTERNACIONALES DE MINERALES PROMEDIO ANUAL<strong>2007</strong> - <strong>2011</strong>MINERALAñoOROUS$ / OzTroyPLATAPLATINOESTAÑOUS$ / tPLOMO ALUMINIO COBRE ZINC NíQUEL HIERRO<strong>2007</strong> 647,46 13,35 1.173,43 12.129,00 1.720,00 2.568,00 5.760,00 3.546,00 38.968,00 84,702008 871,79 14,96 1.569,75 20.325,82 2.256,15 2.826,27 6.927,40 2.024,70 20.936,69 140,602009 973,38 14,70 1.207,93 13.549,36 1.717,71 1.664,06 5.148,35 1.654,35 14.644,04 101,002010 1.224,39 20,15 1.583,92 20.386,57 2.147,18 2.172,27 7.521,54 2.159,88 21.798,40 163,75<strong>2011</strong> 1.568,46 35,13 1.714,55 26.094,26 2.400,58 2.347,71 8.820,06 2.192,45 22.886,55 167,792010Enero 1.117,96 17,81 1.562,75 17.688,25 2.367,03 2.234,53 7.239,50 2.433,78 18.430,00 101,00Febrero 1.095,41 15,87 1.519,40 16.346,25 2.121,23 2.048,23 6.847,20 2.156,08 18.964,75 101,00Marzo 1.113,34 17,11 1.599,43 17.528,91 2.171,24 2.204,78 7.461,91 2.274,39 22.446,30 101,00Abril 1.148,69 18,10 1.715,55 18.669,25 2.264,10 2.316,08 7.743,70 2.366,00 26.014,75 167,00Mayo 1.204,13 18,43 1.628,35 17.550,26 1.881,68 2.039,76 6.836,71 1.967,42 21.995,26 167,00Junio 1.232,26 18,45 1.551,91 17.303,86 1.702,82 1.930,66 6.498,02 1.742,09 19.377,73 167,00Julio 1.192,56 17,96 1.525,59 18.174,55 1.835,82 1.987,30 6.734,00 1.842,89 19.508,18 205,0080Agosto 1.215,81 18,36 1.541,10 20.733,10 2.074,31 2.117,07 7.282,12 2.043,67 21.404,52 205,00Septiembre 1.270,98 20,55 1.591,75 22.685,00 2.183,16 2.161,61 7.709,57 2.150,59 22.637,73 205,00Octubre 1.341,80 23,39 1.688,69 26.325,24 2.378,36 2.345,57 8.291,29 2.371,43 23.796,67 182,00Noviembre 1.370,06 26,54 1.692,77 25.491,59 2.375,48 2.332,16 8.468,39 2.290,59 22.901,59 182,00Diciembre 1.389,70 29,21 1.389,70 26.142,62 2.410,93 2.349,52 9.146,07 2.279,64 24.103,33 182,001.224,39 20,15 1.583,92 20.386,57 2.147,18 2.172,27 7.521,54 2.159,88 21.798,40 163,75<strong>2011</strong>Enero 1.356,40 28,40 1.719,95 27.446,00 2.600,13 2.438,73 9.554,13 2.370,38 25.638,50 179,63Febrero 1.372,73 30,78 1.826,00 31.506,50 2.585,43 2.507,33 9.866,75 2.464,28 28.246,75 187,18Marzo 1.424,01 35,86 1.770,17 30.714,57 2.622,30 2.551,76 9.529,57 2.348,59 26.803,04 169,36Abril 1.473,81 41,97 1.797,61 32.442,78 2.740,08 2.661,92 9.482,56 2.371,61 26.321,39 179,26Mayo 1.514,32 36,85 1.783,81 28.712,25 2.418,70 2.394,75 8.925,93 2.159,60 24.203,00 177,10Junio 1.523,32 35,72 1.764,41 25.560,68 2.511,07 2.331,82 9.044,80 2.229,68 22.344,32 170,88Julio 1.572,81 37,94 1.761,05 27.291,43 2.681,48 2.511,19 9.618,36 2.389,43 23721,43 172,98Agosto 1.755,78 40,30 1.804,36 24.405,00 2.403,48 2.391,66 9.040,34 2.210,84 22.075,23 177,45Septiembre 1.771,88 38,16 1.748,11 22.635,00 2.297,00 2.295,93 8.313,82 2.076,02 20.384,55 177,23Octubre 1.665,21 31,97 1.535,19 21.771,67 1.947,90 2.171,48 7.346,71 1.858,38 18.879,29 150,43Noviembre 1.738,98 33,08 1.596,98 21.235,45 1.981,14 2.000,23 7.550,95 1.915,27 17.876,82 135,54Diciembre 1.652,31 30,47 1.466,94 19.409,75 2.018,20 1.915,75 7.566,78 1.915,33 18.144,25 136,461.568,46 35,13 1.714,55 26.094,26 2.400,58 2.347,71 8.820,06 2.192,45 22.886,55 167,79Fuente: Bolsa <strong>de</strong> Metales <strong>de</strong> Londres (LME) y Kitco. Algunos datos fueron ajustados según lo publicado en http://www.kitco.com/scripts/hist_charts/yearly_graphs.plx In<strong>de</strong>xMundi. según lo publicado en http://www.in<strong>de</strong>xmundi.com/es/precios-<strong>de</strong>-mercado/?mercancia=mineral-<strong>de</strong>-hierro&meses=240Elaboró: UPME, enero <strong>de</strong> 2012