

BoletÃn EstadÃstico de Minas y EnergÃa 2007 - 2011 - simco
BoletÃn EstadÃstico de Minas y EnergÃa 2007 - 2011 - simco
BoletÃn EstadÃstico de Minas y EnergÃa 2007 - 2011 - simco

You also want an ePaper? Increase the reach of your titles
YUMPU automatically turns print PDFs into web optimized ePapers that Google loves.
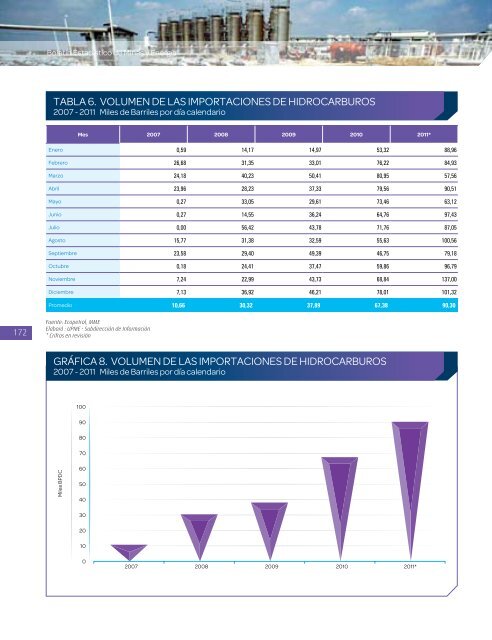
Boletín Estadístico <strong>de</strong> <strong>Minas</strong> y EnergíaTABLA 6. VOLUMEN DE LAS IMPORTACIONES DE HIDROCARBUROS<strong>2007</strong> - <strong>2011</strong> Miles <strong>de</strong> Barriles por día calendarioMes <strong>2007</strong> 2008 2009 2010 <strong>2011</strong>*Enero 0,59 14,17 14,97 53,32 88,96Febrero 26,68 31,35 33,01 76,22 84,93Marzo 24,18 40,23 50,41 80,95 57,56Abril 23,96 28,23 37,33 79,56 90,51Mayo 0,27 33,05 29,61 73,46 63,12Junio 0,27 14,55 36,24 64,76 97,43Julio 0,00 56,42 43,78 71,76 87,05Agosto 15,77 31,38 32,59 55,63 100,56Septiembre 23,58 29,40 49,39 46,75 79,18Octubre 0,18 24,41 37,47 59,86 96,79Noviembre 7,24 22,99 43,73 68,84 137,00Diciembre 7,13 36,92 46,21 78,01 101,32Promedio 10,66 30,32 37,89 67,38 90,30172Fuente: Ecopetrol, MMEElaboró : UPME - Subdirección <strong>de</strong> Información* Crifras en revisiónGRÁFICA 8. VOLUMEN DE LAS IMPORTACIONES DE HIDROCARBUROS<strong>2007</strong> - <strong>2011</strong> Miles <strong>de</strong> Barriles por día calendario100908070Miles BPDC6050403020100<strong>2007</strong> 2008 2009 2010 <strong>2011</strong>*


