

BoletÃn EstadÃstico de Minas y EnergÃa 2007 - 2011 - simco
BoletÃn EstadÃstico de Minas y EnergÃa 2007 - 2011 - simco
BoletÃn EstadÃstico de Minas y EnergÃa 2007 - 2011 - simco

You also want an ePaper? Increase the reach of your titles
YUMPU automatically turns print PDFs into web optimized ePapers that Google loves.
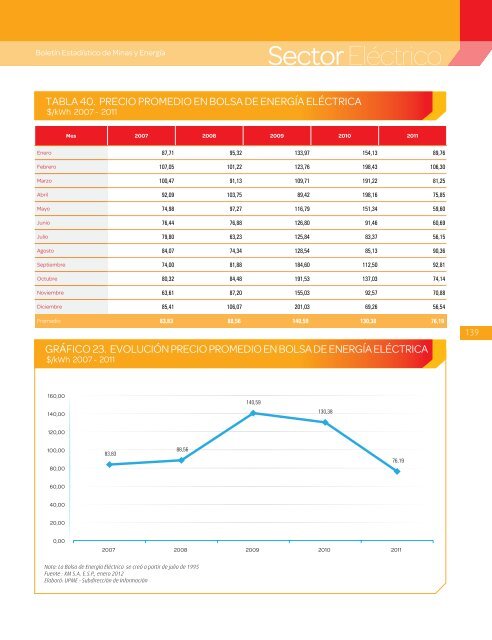
Boletín Estadístico <strong>de</strong> <strong>Minas</strong> y EnergíaSector EléctricoTABLA 40. PRECIO PROMEDIO EN BOLSA DE ENERGÍA ELÉCTRICA$/kWh <strong>2007</strong> - <strong>2011</strong>Mes <strong>2007</strong> 2008 2009 2010 <strong>2011</strong>Enero 87,71 95,32 133,97 154,13 89,76Febrero 107,05 101,22 123,76 198,43 106,30Marzo 100,47 91,13 109,71 191,22 81,25Abril 92,09 103,75 89,42 198,16 75,85Mayo 74,98 97,27 116,79 151,34 59,60Junio 76,44 76,88 126,80 91,46 60,69Julio 79,80 63,23 125,84 83,37 56,15Agosto 84,07 74,34 128,54 85,13 90,36Septiembre 74,00 81,88 184,60 112,50 92,81Octubre 80,32 84,48 191,53 137,03 74,14Noviembre 63,61 87,20 155,03 92,57 70,88Diciembre 85,41 106,07 201,03 69,26 56,54Promedio 83,83 88,56 140,59 130,38 76,19GRÁFICO 23. EVOLUCIÓN PRECIO PROMEDIO EN BOLSA DE ENERGÍA ELÉCTRICA$/kWh <strong>2007</strong> - <strong>2011</strong>139160,00140,00140,59130,38120,00100,0080,0083,8388,5676,1960,0040,0020,000,00<strong>2007</strong> 2008 2009 2010 <strong>2011</strong>Nota: La Bolsa <strong>de</strong> Energía Eléctrica se creó a partir <strong>de</strong> julio <strong>de</strong> 1995Fuente : XM S.A. E.S.P., enero 2012Elaboró: UPME - Subdirección <strong>de</strong> Información


