

BoletÃn EstadÃstico de Minas y EnergÃa 2007 - 2011 - simco
BoletÃn EstadÃstico de Minas y EnergÃa 2007 - 2011 - simco
BoletÃn EstadÃstico de Minas y EnergÃa 2007 - 2011 - simco

Create successful ePaper yourself
Turn your PDF publications into a flip-book with our unique Google optimized e-Paper software.
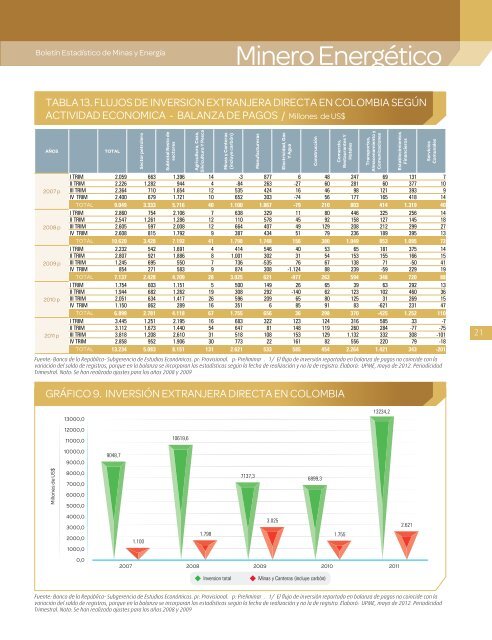
Boletín Estadístico <strong>de</strong> <strong>Minas</strong> y EnergíaMinero EnergéticoTABLA 13. FLUJOS DE INVERSION EXTRANJERA DIRECTA EN COLOMBIA SEGÚNACTIVIDAD ECONOMICA - BALANZA DE PAGOS / Millones <strong>de</strong> US$AÑOS<strong>2007</strong> p2008 p2009 p2010 p<strong>2011</strong> pTOTALSector petroleroSubtotal Resto <strong>de</strong>sectoresAgricultura, Caza,Silvicultura Y Pesca<strong>Minas</strong> y Canteras(incluye carbón)ManufacturerasI TRIM 2.059 663 1.396 14 -3 877 6 48 247 69 131 7II TRIM 2.226 1.282 944 4 -84 263 -27 60 281 60 377 10III TRIM 2.364 710 1.654 12 535 424 16 46 98 121 393 9IV TRIM 2.400 679 1.721 10 652 303 -74 56 177 165 418 14TOTAL 9.049 3.333 5.716 40 1.100 1.867 -79 210 803 414 1.319 40I TRIM 2.860 754 2.106 7 638 329 11 80 446 325 256 14II TRIM 2.547 1.261 1.286 12 110 578 45 92 158 127 145 18III TRIM 2.605 597 2.008 12 664 407 49 129 208 212 299 27IV TRIM 2.608 815 1.792 9 387 434 51 79 236 189 395 13TOTAL 10.620 3.428 7.192 41 1.798 1.748 156 380 1.049 853 1.095 72I TRIM 2.232 542 1.691 4 414 546 40 53 65 181 375 14II TRIM 2.807 921 1.886 8 1.001 302 31 54 153 155 166 15III TRIM 1.245 695 550 7 736 -535 76 67 138 71 -50 41IV TRIM 854 271 583 9 874 308 -1.124 88 239 -59 229 19TOTAL 7.137 2.428 4.709 28 3.025 621 -977 262 594 348 720 88I TRIM 1.754 603 1.151 5 500 149 26 65 39 63 292 13II TRIM 1.944 682 1.262 19 308 292 -140 62 123 102 460 36III TRIM 2.051 634 1.417 26 596 209 65 80 125 31 269 15IV TRIM 1.150 862 289 16 351 6 85 91 83 -621 231 47TOTAL 6.899 2.781 4.118 67 1.755 656 36 298 370 -425 1.252 110I TRIM 3.445 1.251 2.195 16 683 322 123 124 316 585 33 -7II TRIM 3.112 1.673 1.440 54 647 81 148 119 260 284 -77 -75III TRIM 3.818 1.208 2.610 31 518 108 153 129 1.132 332 308 -101IV TRIM 2.858 952 1.906 30 773 22 161 82 556 220 79 -18TOTAL 13.234 5.083 8.151 131 2.621 533 585 454 2.264 1.421 343 -201Fuente: Banco <strong>de</strong> la República- Subgerencia <strong>de</strong> Estudios Económicos. pr: Provisional. p: Preliminar . 1/ El flujo <strong>de</strong> inversión reportado en balanza <strong>de</strong> pagos no coinci<strong>de</strong> con lavariación <strong>de</strong>l saldo <strong>de</strong> registros, porque en la balanza se incorporan las estadísticas según la fecha <strong>de</strong> realización y no la <strong>de</strong> registro. Elaboró: UPME, mayo <strong>de</strong> 2012. PeriodicidadTrimestral. Nota: Se han realizado ajustes para los años 2008 y 2009Electricidad, GasY AguaConstrucciónComercio,Restaurantes YHotelesTransportes,Almacenamiento yComunicacionesEstablecimientosFinancierosServiciosComunales21GRÁFICO 9. INVERSIÓN EXTRANJERA DIRECTA EN COLOMBIAMillones <strong>de</strong> US$13000,012000,011000,010000,09000,08000,07000,06000,05000,04000,03000,02000,01000,00,013234,210619,69048,77137,36899,33.0252.6211.7981.7551.100<strong>2007</strong> 2008 2009 2010 <strong>2011</strong>Inversion total<strong>Minas</strong> y Canteras (incluye carbón)Fuente: Banco <strong>de</strong> la República- Subgerencia <strong>de</strong> Estudios Económicos. pr: Provisional. p: Preliminar . 1/ El flujo <strong>de</strong> inversión reportado en balanza <strong>de</strong> pagos no coinci<strong>de</strong> con lavariación <strong>de</strong>l saldo <strong>de</strong> registros, porque en la balanza se incorporan las estadísticas según la fecha <strong>de</strong> realización y no la <strong>de</strong> registro. Elaboró: UPME, mayo <strong>de</strong> 2012. PeriodicidadTrimestral. Nota: Se han realizado ajustes para los años 2008 y 2009


