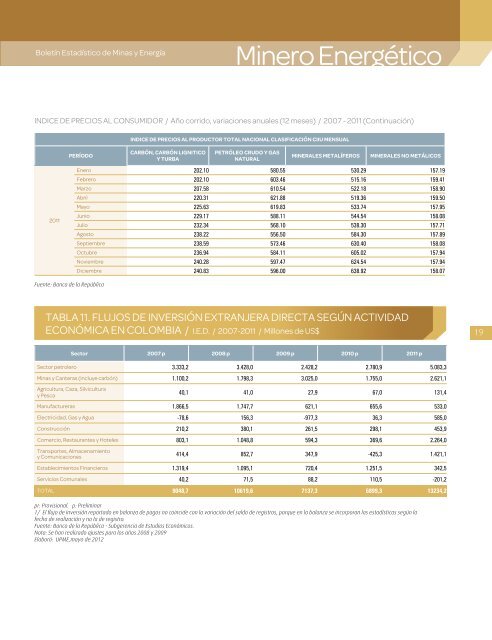
Boletín Estadístico <strong>de</strong> <strong>Minas</strong> y EnergíaMinero EnergéticoINDICE DE PRECIOS AL CONSUMIDOR / Año corrido, variaciones anuales (12 meses) / <strong>2007</strong> - <strong>2011</strong> (Continuación)INDICE DE PRECIOS AL PRODUCTOR TOTAL NACIONAL CLASIFICACIÓN CIIU MENSUALPERÍODOCARBÓN, CARBÓN LIGNITICOY TURBAPETRÓLEO CRUDO Y GASNATURALMINERALES METALÍFEROSMINERALES NO METÁLICOS<strong>2011</strong>Enero 202.10 580.55 530.29 157.19Febrero 202.10 603.46 515.16 159.41Marzo 207.58 610.54 522.18 158.90Abril 220.31 621.88 519.36 159.50Mayo 225.63 619.83 533.74 157.95Junio 229.17 588.11 544.54 158.08Julio 232.34 568.10 538.30 157.71Agosto 238.22 556.50 584.30 157.89Septiembre 238.59 573.46 630.40 158.08Octubre 236.94 584.11 605.02 157.94Noviembre 240.28 597.47 624.54 157.94Diciembre 240.83 596.00 638.92 158.07Fuente: Banco <strong>de</strong> la RepúblicaTABLA 11. FLUJOS DE INVERSIÓN EXTRANJERA DIRECTA SEGÚN ACTIVIDADECONÓMICA EN COLOMBIA / I.E.D. / <strong>2007</strong>-<strong>2011</strong> / Millones <strong>de</strong> US$19Sector <strong>2007</strong> p 2008 p 2009 p 2010 p <strong>2011</strong> pSector petrolero 3.333,2 3.428,0 2.428,2 2.780,9 5.083,3<strong>Minas</strong> y Canteras (incluye carbón) 1.100,2 1.798,3 3.025,0 1.755,0 2.621,1Agricultura, Caza, Silviculturay Pesca40,1 41,0 27,9 67,0 131,4Manufactureras 1.866,5 1.747,7 621,1 655,6 533,0Electricidad, Gas y Agua -78,6 156,3 -977,3 36,3 585,0Construcción 210,2 380,1 261,5 298,1 453,9Comercio, Restaurantes y Hoteles 803,1 1.048,8 594,3 369,6 2.264,0Transportes, Almacenamientoy Comunicaciones 414,4 852,7 347,9 -425,3 1.421,1Establecimientos Financieros 1.319,4 1.095,1 720,4 1.251,5 342,5Servicios Comunales 40,2 71,5 88,2 110,5 -201,2TOTAL 9048,7 10619,6 7137,3 6899,3 13234,2pr: Provisional. p: Preliminar1/ El flujo <strong>de</strong> inversión reportado en balanza <strong>de</strong> pagos no coinci<strong>de</strong> con la variación <strong>de</strong>l saldo <strong>de</strong> registros, porque en la balanza se incorporan las estadísticas según lafecha <strong>de</strong> realización y no la <strong>de</strong> registro.Fuente: Banco <strong>de</strong> la República - Subgerencia <strong>de</strong> Estudios Económicos.Nota: Se han realizado ajustes para los años 2008 y 2009Elaboró: UPME,mayo <strong>de</strong> 2012
Boletín Estadístico <strong>de</strong> <strong>Minas</strong> y EnergíaTABLA 12. DESAGREGACIÓN DE LA IED EN MINAS Y CANTERASMillones <strong>de</strong> US$ACTIVIDAD <strong>2007</strong> p 2008 p 2009 p 2010 p <strong>2011</strong> pEXPLOTACION DE MINASY CANTERAS 4.433,4 5.203,0 5.453,2 4.535,9 7.704,4Sector Petrolero 3.333,2 3.428,0 2.428,2 2.780,9 5.083,3Extracción <strong>de</strong> carbón, lignito y turba 1.844,5 2.198,6 2.858,2 1.502,8 2.131,6Extracción <strong>de</strong> minerales metalíferos 49,9 98,0 128,5 205,3 398,8Reinversión <strong>de</strong> Utilida<strong>de</strong>s y OtrasActivida<strong>de</strong>s -794,2 -498,2 38,3 46,8 90,7Flujo Neto Sector Minero - Energético 4433,4 5226,3 5453,2 4535,9 7704,4TOTAL INVERSION EXTRANJERADIRECTA 9048,7 10619,6 7137,3 6899,3 13234,2Participación IED en <strong>Minas</strong> y Canterasen Total IED 49,0% 49,0% 76,4% 65,7% 58,2%Participación IED en el Sector Petroleoen Total IED 36,8% 32,3% 34,0% 40,3% 38,4%Participación IED en Carbón ,Lignito yturba en Total IED 20,4% 20,7% 40,0% 21,8% 16,1%Participación IED en Extracción <strong>de</strong>Minerales Metaliferos en Total IED 0,6% 0,9% 1,8% 3,0% 3,0%20pr: preliminar.p: provisional.Fuente: Sección Sector Externo, Subgerencia <strong>de</strong> Estudios Económicos, Banco <strong>de</strong> la República.Elaboró: UPME - Subdirección <strong>de</strong> Información , actualizó Subdirección <strong>de</strong> Planeación MineraGRÁFICO 8. PARTICIPACIONES IED90%80%70%60%50%40%30%20%10%0%<strong>2007</strong> p 2008 p 2009 p 2010 p <strong>2011</strong> pParticipación IED en <strong>Minas</strong> y Canteras en Total IEDParticipación IED en Carbón ,Lignito y turba en Total IEDParticipación IED en el Sector Petroleo en Total IEDParticipación IED en Extracción <strong>de</strong> Minerales Metaliferos en Total IED
- Page 8: Boletín Estadístico de Minas y En
- Page 11 and 12: Boletín Estadístico de Minas y En
- Page 13 and 14: Boletín Estadístico de Minas y En
- Page 15 and 16: Boletín Estadístico de Minas y En
- Page 17 and 18: Boletín Estadístico de Minas y En
- Page 19: Boletín Estadístico de Minas y En
- Page 24 and 25: Indicadores InternacionalesSectorHi
- Page 26 and 27: Boletín Estadístico de Minas y En
- Page 28 and 29: Boletín Estadístico de Minas y En
- Page 30 and 31: Boletín Estadístico de Minas y En
- Page 32 and 33: Boletín Estadístico de Minas y En
- Page 34 and 35: Boletín Estadístico de Minas y En
- Page 36 and 37: Boletín Estadístico de Minas y En
- Page 38 and 39: Boletín Estadístico de Minas y En
- Page 40 and 41: Indicadores InternacionalesSectorMi
- Page 42 and 43: Boletín Estadístico de Minas y En
- Page 44 and 45: Boletín Estadístico de Minas y En
- Page 46 and 47: Boletín Estadístico de Minas y En
- Page 48: Boletín Estadístico de Minas y En
- Page 51 and 52: Boletín Estadístico de Minas y En
- Page 53 and 54: Boletín Estadístico de Minas y En
- Page 55 and 56: Boletín Estadístico de Minas y En
- Page 57 and 58: Boletín Estadístico de Minas y En
- Page 59 and 60: Boletín Estadístico de Minas y En
- Page 61 and 62: Boletín Estadístico de Minas y En
- Page 63 and 64: Boletín Estadístico de Minas y En
- Page 65 and 66: Boletín Estadístico de Minas y En
- Page 67 and 68: Boletín Estadístico de Minas y En
- Page 69 and 70: Boletín Estadístico de Minas y En
- Page 71 and 72:
Boletín Estadístico de Minas y En
- Page 73 and 74:
Boletín Estadístico de Minas y En
- Page 75 and 76:
Boletín Estadístico de Minas y En
- Page 77 and 78:
Boletín Estadístico de Minas y En
- Page 79 and 80:
Boletín Estadístico de Minas y En
- Page 81 and 82:
Boletín Estadístico de Minas y En
- Page 83 and 84:
Boletín Estadístico de Minas y En
- Page 86 and 87:
Boletín Estadístico de Minas y En
- Page 88 and 89:
Boletín Estadístico de Minas y En
- Page 90 and 91:
Boletín Estadístico de Minas y En
- Page 92 and 93:
Boletín Estadístico de Minas y En
- Page 94 and 95:
Boletín Estadístico de Minas y En
- Page 96 and 97:
Boletín Estadístico de Minas y En
- Page 98 and 99:
Boletín Estadístico de Minas y En
- Page 100 and 101:
Boletín Estadístico de Minas y En
- Page 102 and 103:
Boletín Estadístico de Minas y En
- Page 104 and 105:
Boletín Estadístico de Minas y En
- Page 106 and 107:
Boletín Estadístico de Minas y En
- Page 108 and 109:
Boletín Estadístico de Minas y En
- Page 110 and 111:
Boletín Estadístico de Minas y En
- Page 112 and 113:
Boletín Estadístico de Minas y En
- Page 114 and 115:
Boletín Estadístico de Minas y En
- Page 116 and 117:
Boletín Estadístico de Minas y En
- Page 118 and 119:
Boletín Estadístico de Minas y En
- Page 120 and 121:
Boletín Estadístico de Minas y En
- Page 122 and 123:
Boletín Estadístico de Minas y En
- Page 124 and 125:
Boletín Estadístico de Minas y En
- Page 126 and 127:
Boletín Estadístico de Minas y En
- Page 128 and 129:
Boletín Estadístico de Minas y En
- Page 130 and 131:
Boletín Estadístico de Minas y En
- Page 132 and 133:
Boletín Estadístico de Minas y En
- Page 134 and 135:
Boletín Estadístico de Minas y En
- Page 136 and 137:
Boletín Estadístico de Minas y En
- Page 138 and 139:
Boletín Estadístico de Minas y En
- Page 140 and 141:
Boletín Estadístico de Minas y En
- Page 142 and 143:
Boletín Estadístico de Minas y En
- Page 144 and 145:
Boletín Estadístico de Minas y En
- Page 146 and 147:
Boletín Estadístico de Minas y En
- Page 148 and 149:
Boletín Estadístico de Minas y En
- Page 150 and 151:
Boletín Estadístico de Minas y En
- Page 152 and 153:
Boletín Estadístico de Minas y En
- Page 154 and 155:
Boletín Estadístico de Minas y En
- Page 156 and 157:
Boletín Estadístico de Minas y En
- Page 158 and 159:
Boletín Estadístico de Minas y En
- Page 160 and 161:
Boletín Estadístico de Minas y En
- Page 162 and 163:
SectorHidrocarburosBoletín Estadí
- Page 164 and 165:
Boletín Estadístico de Minas y En
- Page 166 and 167:
Boletín Estadístico de Minas y En
- Page 168 and 169:
Boletín Estadístico de Minas y En
- Page 170 and 171:
Boletín Estadístico de Minas y En
- Page 172 and 173:
Boletín Estadístico de Minas y En
- Page 174 and 175:
Boletín Estadístico de Minas y En
- Page 176 and 177:
Boletín Estadístico de Minas y En
- Page 178 and 179:
Boletín Estadístico de Minas y En
- Page 180:
Boletín Estadístico de Minas y En
- Page 183 and 184:
Boletín Estadístico de Minas y En
- Page 185 and 186:
Boletín Estadístico de Minas y En
- Page 187 and 188:
Boletín Estadístico de Minas y En
- Page 189 and 190:
Boletín Estadístico de Minas y En
- Page 191 and 192:
Boletín Estadístico de Minas y En
- Page 193 and 194:
Boletín Estadístico de Minas y En
- Page 195:
Boletín Estadístico de Minas y En
- Page 198:
Boletín Estadístico de Minas y En
- Page 201 and 202:
Boletín Estadístico de Minas y En
- Page 203 and 204:
Boletín Estadístico de Minas y En
- Page 205 and 206:
Boletín Estadístico de Minas y En
- Page 208 and 209:
Boletín Estadístico de Minas y En
- Page 210 and 211:
Boletín Estadístico de Minas y En
- Page 212 and 213:
Boletín Estadístico de Minas y En
- Page 214 and 215:
Boletín Estadístico de Minas y En
- Page 216 and 217:
Boletín Estadístico de Minas y En
- Page 218 and 219:
Boletín Estadístico de Minas y En
- Page 220 and 221:
Boletín Estadístico de Minas y En
- Page 222 and 223:
Boletín Estadístico de Minas y En
- Page 224 and 225:
Boletín Estadístico de Minas y En
- Page 226 and 227:
Boletín Estadístico de Minas y En
- Page 228 and 229:
Boletín Estadístico de Minas y En
- Page 230 and 231:
Boletín Estadístico de Minas y En
- Page 232 and 233:
Boletín Estadístico de Minas y En
- Page 234 and 235:
Boletín Estadístico de Minas y En
- Page 236 and 237:
Boletín Estadístico de Minas y En
- Page 238 and 239:
Boletín Estadístico de Minas y En
- Page 240 and 241:
Boletín Estadístico de Minas y En
- Page 242:
Boletín Estadístico de Minas y En