

BoletÃn EstadÃstico de Minas y EnergÃa 2007 - 2011 - simco
BoletÃn EstadÃstico de Minas y EnergÃa 2007 - 2011 - simco
BoletÃn EstadÃstico de Minas y EnergÃa 2007 - 2011 - simco

You also want an ePaper? Increase the reach of your titles
YUMPU automatically turns print PDFs into web optimized ePapers that Google loves.
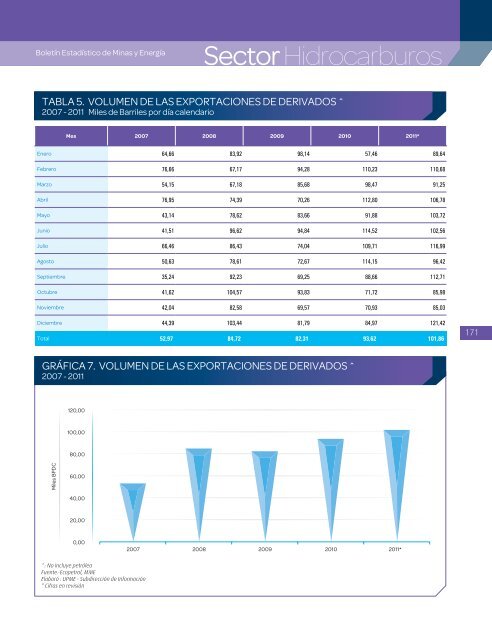
Boletín Estadístico <strong>de</strong> <strong>Minas</strong> y EnergíaSector HidrocarburosTABLA 5. VOLUMEN DE LAS EXPORTACIONES DE DERIVADOS ^<strong>2007</strong> - <strong>2011</strong> Miles <strong>de</strong> Barriles por día calendarioMes <strong>2007</strong> 2008 2009 2010 <strong>2011</strong>*Enero 64,66 83,92 98,14 57,46 89,64Febrero 76,66 67,17 94,28 110,23 110,68Marzo 54,15 67,18 85,68 98,47 91,25Abril 76,95 74,39 70,26 112,80 106,78Mayo 43,14 78,62 83,66 91,88 103,72Junio 41,51 96,62 94,84 114,52 102,56Julio 66,46 86,43 74,04 109,71 116,99Agosto 50,63 78,61 72,67 114,15 96,42Septiembre 35,24 92,23 69,25 88,66 112,71Octubre 41,62 104,57 93,83 71,72 85,98Noviembre 42,04 82,58 69,57 70,93 85,03Diciembre 44,39 103,44 81,79 84,97 121,42Total 52,97 84,72 82,31 93,62 101,86171GRÁFICA 7. VOLUMEN DE LAS EXPORTACIONES DE DERIVADOS ^<strong>2007</strong> - <strong>2011</strong>120,00100,0080,00Miles BPDC60,0040,0020,000,00<strong>2007</strong> 2008 2009 2010 <strong>2011</strong>*^: No incluye petróleoFuente: Ecopetrol, MMEElaboró : UPME - Subdirección <strong>de</strong> Información* Cifras en revisión


