

BoletÃn EstadÃstico de Minas y EnergÃa 2007 - 2011 - simco
BoletÃn EstadÃstico de Minas y EnergÃa 2007 - 2011 - simco
BoletÃn EstadÃstico de Minas y EnergÃa 2007 - 2011 - simco

You also want an ePaper? Increase the reach of your titles
YUMPU automatically turns print PDFs into web optimized ePapers that Google loves.
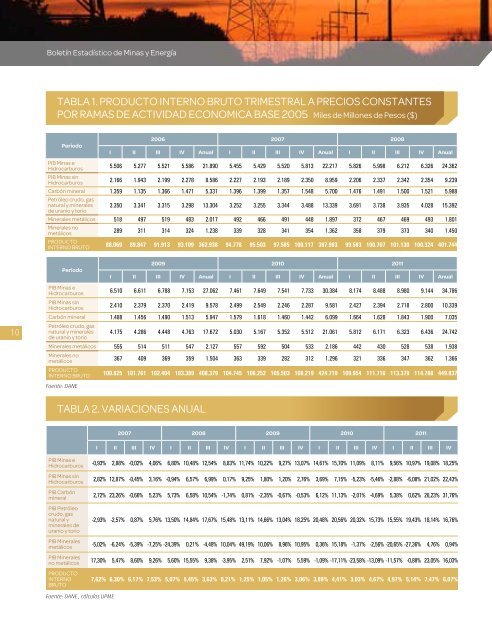
Boletín Estadístico <strong>de</strong> <strong>Minas</strong> y EnergíaTABLA 1. PRODUCTO INTERNO BRUTO TRIMESTRAL A PRECIOS CONSTANTESPOR RAMAS DE ACTIVIDAD ECONOMICA BASE 2005 Miles <strong>de</strong> Millones <strong>de</strong> Pesos ($)Periodo2006 <strong>2007</strong> 2008I II III IV Anual I II III IV Anual I II III IV AnualPIB <strong>Minas</strong> eHidrocarburos 5.506 5.277 5.521 5.586 21.890 5.455 5.429 5.520 5.813 22.217 5.826 5.998 6.212 6.326 24.362PIB <strong>Minas</strong> sinHidrocarburos 2.166 1.943 2.199 2.278 8.586 2.227 2.193 2.189 2.350 8.959 2.206 2.337 2.342 2.354 9.239Carbón mineral 1.359 1.135 1.366 1.471 5.331 1.396 1.399 1.357 1.548 5.700 1.476 1.491 1.500 1.521 5.988Petróleo crudo, gasnatural y minerales<strong>de</strong> uranio y torio3.350 3.341 3.315 3.298 13.304 3.252 3.255 3.344 3.488 13.339 3.691 3.738 3.935 4.028 15.392Minerales metálicos 518 497 519 483 2.017 492 466 491 448 1.897 372 467 469 493 1.801Minerales nometálicos 289 311 314 324 1.238 339 328 341 354 1.362 358 379 373 340 1.450PRODUCTOINTERNO BRUTO 88.069 89.847 91.913 93.109 362.938 94.778 95.503 97.585 100.117 387.983 99.583 100.707 101.130 100.324 401.74410Periodo2009 2010 <strong>2011</strong>I II III IV Anual I II III IV Anual I II III IV AnualPIB <strong>Minas</strong> eHidrocarburos 6.510 6.611 6.788 7.153 27.062 7.461 7.649 7.541 7.733 30.384 8.174 8.488 8.980 9.144 34.786PIB <strong>Minas</strong> sinHidrocarburos 2.410 2.379 2.370 2.419 9.578 2.499 2.549 2.246 2.287 9.581 2.427 2.394 2.718 2.800 10.339Carbón mineral 1.488 1.456 1.490 1.513 5.947 1.579 1.618 1.460 1.442 6.099 1.664 1.628 1.843 1.900 7.035Petróleo crudo, gasnatural y minerales<strong>de</strong> uranio y torio4.175 4.286 4.448 4.763 17.672 5.030 5.167 5.352 5.512 21.061 5.812 6.171 6.323 6.436 24.742Minerales metálicos 555 514 511 547 2.127 557 592 504 533 2.186 442 430 528 538 1.938Minerales nometálicos 367 409 369 359 1.504 363 339 282 312 1.296 321 336 347 362 1.366PRODUCTOINTERNO BRUTO 100.825 101.761 102.404 103.389 408.379 104.745 106.252 105.503 108.219 424.719 109.954 111.716 113.379 114.788 449.837Fuente: DANETABLA 2. VARIACIONES ANUAL<strong>2007</strong> 2008 2009 2010 <strong>2011</strong>I II III IV I II III IV I II III IV I II III IV I II III IVPIB <strong>Minas</strong> eHidrocarburos -0,93% 2,88% -0,02% 4,06% 6,80% 10,48% 12,54% 8,83% 11,74% 10,22% 9,27% 13,07% 14,61% 15,70% 11,09% 8,11% 9,56% 10,97% 19,08% 18,25%PIB <strong>Minas</strong> sinHidrocarburos 2,82% 12,87% -0,45% 3,16% -0,94% 6,57% 6,99% 0,17% 9,25% 1,80% 1,20% 2,76% 3,69% 7,15% -5,23% -5,46% -2,88% -6,08% 21,02% 22,43%PIB Carbónmineral 2,72% 23,26% -0,66% 5,23% 5,73% 6,58% 10,54% -1,74% 0,81% -2,35% -0,67% -0,53% 6,12% 11,13% -2,01% -4,69% 5,38% 0,62% 26,23% 31,76%PIB Petróleocrudo, gasnatural yminerales <strong>de</strong>uranio y torio-2,93% -2,57% 0,87% 5,76% 13,50% 14,84% 17,67% 15,48% 13,11% 14,66% 13,04% 18,25% 20,48% 20,56% 20,32% 15,73% 15,55% 19,43% 18,14% 16,76%PIB Mineralesmetálicos -5,02% -6,24% -5,39% -7,25% -24,39% 0,21% -4,48% 10,04% 49,19% 10,06% 8,96% 10,95% 0,36% 15,18% -1,37% -2,56% -20,65% -27,36% 4,76% 0,94%PIB Mineralesno metálicos 17,30% 5,47% 8,60% 9,26% 5,60% 15,55% 9,38% -3,95% 2,51% 7,92% -1,07% 5,59% -1,09% -17,11% -23,58% -13,09% -11,57% -0,88% 23,05% 16,03%PRODUCTOINTERNOBRUTOFuente: DANE , cálculos UPME7,62% 6,30% 6,17% 7,53% 5,07% 5,45% 3,63% 0,21% 1,25% 1,05% 1,26% 3,06% 3,89% 4,41% 3,03% 4,67% 4,97% 5,14% 7,47% 6,07%


