

BoletÃn EstadÃstico de Minas y EnergÃa 2007 - 2011 - simco
BoletÃn EstadÃstico de Minas y EnergÃa 2007 - 2011 - simco
BoletÃn EstadÃstico de Minas y EnergÃa 2007 - 2011 - simco

Create successful ePaper yourself
Turn your PDF publications into a flip-book with our unique Google optimized e-Paper software.
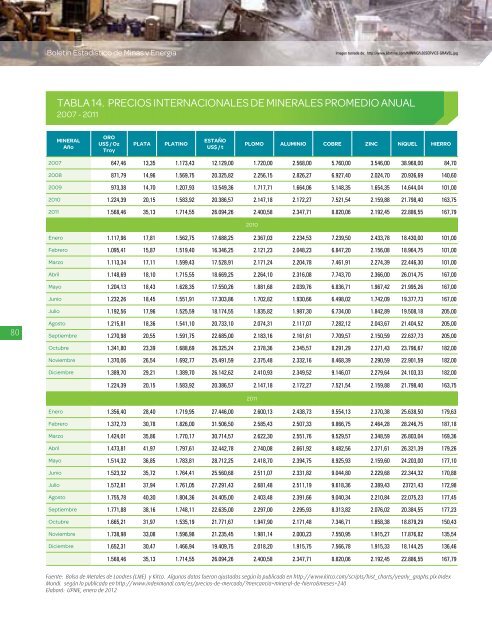
Boletín Estadístico <strong>de</strong> <strong>Minas</strong> y EnergíaImagen tomada <strong>de</strong>: http://www.lidstone.com/MINING%20SERVICE-GRAVEL.jpgTABLA 14. PRECIOS INTERNACIONALES DE MINERALES PROMEDIO ANUAL<strong>2007</strong> - <strong>2011</strong>MINERALAñoOROUS$ / OzTroyPLATAPLATINOESTAÑOUS$ / tPLOMO ALUMINIO COBRE ZINC NíQUEL HIERRO<strong>2007</strong> 647,46 13,35 1.173,43 12.129,00 1.720,00 2.568,00 5.760,00 3.546,00 38.968,00 84,702008 871,79 14,96 1.569,75 20.325,82 2.256,15 2.826,27 6.927,40 2.024,70 20.936,69 140,602009 973,38 14,70 1.207,93 13.549,36 1.717,71 1.664,06 5.148,35 1.654,35 14.644,04 101,002010 1.224,39 20,15 1.583,92 20.386,57 2.147,18 2.172,27 7.521,54 2.159,88 21.798,40 163,75<strong>2011</strong> 1.568,46 35,13 1.714,55 26.094,26 2.400,58 2.347,71 8.820,06 2.192,45 22.886,55 167,792010Enero 1.117,96 17,81 1.562,75 17.688,25 2.367,03 2.234,53 7.239,50 2.433,78 18.430,00 101,00Febrero 1.095,41 15,87 1.519,40 16.346,25 2.121,23 2.048,23 6.847,20 2.156,08 18.964,75 101,00Marzo 1.113,34 17,11 1.599,43 17.528,91 2.171,24 2.204,78 7.461,91 2.274,39 22.446,30 101,00Abril 1.148,69 18,10 1.715,55 18.669,25 2.264,10 2.316,08 7.743,70 2.366,00 26.014,75 167,00Mayo 1.204,13 18,43 1.628,35 17.550,26 1.881,68 2.039,76 6.836,71 1.967,42 21.995,26 167,00Junio 1.232,26 18,45 1.551,91 17.303,86 1.702,82 1.930,66 6.498,02 1.742,09 19.377,73 167,00Julio 1.192,56 17,96 1.525,59 18.174,55 1.835,82 1.987,30 6.734,00 1.842,89 19.508,18 205,0080Agosto 1.215,81 18,36 1.541,10 20.733,10 2.074,31 2.117,07 7.282,12 2.043,67 21.404,52 205,00Septiembre 1.270,98 20,55 1.591,75 22.685,00 2.183,16 2.161,61 7.709,57 2.150,59 22.637,73 205,00Octubre 1.341,80 23,39 1.688,69 26.325,24 2.378,36 2.345,57 8.291,29 2.371,43 23.796,67 182,00Noviembre 1.370,06 26,54 1.692,77 25.491,59 2.375,48 2.332,16 8.468,39 2.290,59 22.901,59 182,00Diciembre 1.389,70 29,21 1.389,70 26.142,62 2.410,93 2.349,52 9.146,07 2.279,64 24.103,33 182,001.224,39 20,15 1.583,92 20.386,57 2.147,18 2.172,27 7.521,54 2.159,88 21.798,40 163,75<strong>2011</strong>Enero 1.356,40 28,40 1.719,95 27.446,00 2.600,13 2.438,73 9.554,13 2.370,38 25.638,50 179,63Febrero 1.372,73 30,78 1.826,00 31.506,50 2.585,43 2.507,33 9.866,75 2.464,28 28.246,75 187,18Marzo 1.424,01 35,86 1.770,17 30.714,57 2.622,30 2.551,76 9.529,57 2.348,59 26.803,04 169,36Abril 1.473,81 41,97 1.797,61 32.442,78 2.740,08 2.661,92 9.482,56 2.371,61 26.321,39 179,26Mayo 1.514,32 36,85 1.783,81 28.712,25 2.418,70 2.394,75 8.925,93 2.159,60 24.203,00 177,10Junio 1.523,32 35,72 1.764,41 25.560,68 2.511,07 2.331,82 9.044,80 2.229,68 22.344,32 170,88Julio 1.572,81 37,94 1.761,05 27.291,43 2.681,48 2.511,19 9.618,36 2.389,43 23721,43 172,98Agosto 1.755,78 40,30 1.804,36 24.405,00 2.403,48 2.391,66 9.040,34 2.210,84 22.075,23 177,45Septiembre 1.771,88 38,16 1.748,11 22.635,00 2.297,00 2.295,93 8.313,82 2.076,02 20.384,55 177,23Octubre 1.665,21 31,97 1.535,19 21.771,67 1.947,90 2.171,48 7.346,71 1.858,38 18.879,29 150,43Noviembre 1.738,98 33,08 1.596,98 21.235,45 1.981,14 2.000,23 7.550,95 1.915,27 17.876,82 135,54Diciembre 1.652,31 30,47 1.466,94 19.409,75 2.018,20 1.915,75 7.566,78 1.915,33 18.144,25 136,461.568,46 35,13 1.714,55 26.094,26 2.400,58 2.347,71 8.820,06 2.192,45 22.886,55 167,79Fuente: Bolsa <strong>de</strong> Metales <strong>de</strong> Londres (LME) y Kitco. Algunos datos fueron ajustados según lo publicado en http://www.kitco.com/scripts/hist_charts/yearly_graphs.plx In<strong>de</strong>xMundi. según lo publicado en http://www.in<strong>de</strong>xmundi.com/es/precios-<strong>de</strong>-mercado/?mercancia=mineral-<strong>de</strong>-hierro&meses=240Elaboró: UPME, enero <strong>de</strong> 2012


