

BoletÃn EstadÃstico de Minas y EnergÃa 2007 - 2011 - simco
BoletÃn EstadÃstico de Minas y EnergÃa 2007 - 2011 - simco
BoletÃn EstadÃstico de Minas y EnergÃa 2007 - 2011 - simco

You also want an ePaper? Increase the reach of your titles
YUMPU automatically turns print PDFs into web optimized ePapers that Google loves.
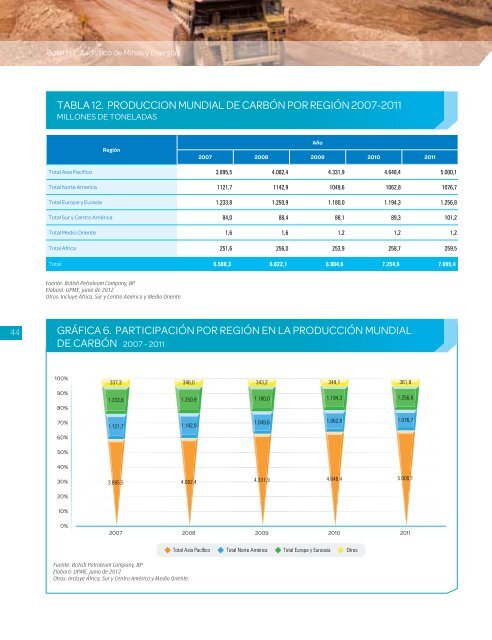
Boletín Estadístico <strong>de</strong> <strong>Minas</strong> y EnergíaTABLA 12. PRODUCCION MUNDIAL DE CARBÓN POR REGIÓN <strong>2007</strong>-<strong>2011</strong>MILLONES DE TONELADASRegiónAño<strong>2007</strong> 2008 2009 2010 <strong>2011</strong>Total Asia Pacifico 3.895,5 4.082,4 4.331,9 4.648,4 5.000,1Total Norte America 1121,7 1142,9 1049,6 1062,8 1076,7Total Europe y Eurasia 1.233,8 1.250,9 1.180,0 1.194,3 1.256,8Total Sur y Centro América 84,0 88,4 88,1 89,3 101,2Total Medio Oriente 1,6 1,6 1,2 1,2 1,2Total Africa 251,6 256,0 253,9 258,7 259,5Total 6.588,3 6.822,1 6.904,6 7.254,6 7.695,4Fuente: British Petroleum Company, BPElaboró: UPME, junio <strong>de</strong> 2012Otros: Incluye África, Sur y Centro América y Medio Oriente.44GRÁFICA 6. PARTICIPACIÓN POR REGIÓN EN LA PRODUCCIÓN MUNDIALDE CARBÓN <strong>2007</strong> - <strong>2011</strong>100%90%80%337,3 346,0 343,2 349,1 361,91.233,8 1.250,9 1.180,0 1.194,3 1.256,870%60%50%1.121,7 1.142,91.049,6 1.062,8 1.076,740%30%3.895,5 4.082,4 4.331,9 4.648,4 5.000,120%10%0%<strong>2007</strong> 2008 2009 2010 <strong>2011</strong>Fuente: British Petroleum Company, BPElaboró: UPME, junio <strong>de</strong> 2012Otros: Incluye África, Sur y Centro América y Medio Oriente.Total Asia Pacífico Total Norte América Total Europa y Euroasia Otros


