

BoletÃn EstadÃstico de Minas y EnergÃa 2007 - 2011 - simco
BoletÃn EstadÃstico de Minas y EnergÃa 2007 - 2011 - simco
BoletÃn EstadÃstico de Minas y EnergÃa 2007 - 2011 - simco

You also want an ePaper? Increase the reach of your titles
YUMPU automatically turns print PDFs into web optimized ePapers that Google loves.
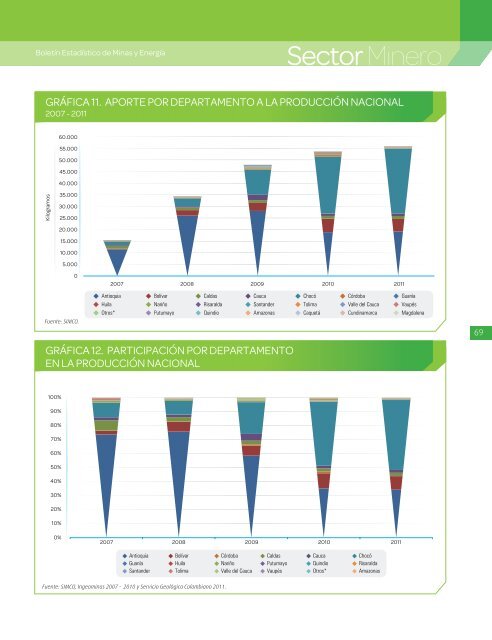
Boletín Estadístico <strong>de</strong> <strong>Minas</strong> y EnergíaSector MineroGRÁFICA 11. APORTE POR DEPARTAMENTO A LA PRODUCCIÓN NACIONAL<strong>2007</strong> - <strong>2011</strong>60.00055.00050.00045.00040.000Kilogramos35.00030.00025.00020.00015.00010.0005.0000<strong>2007</strong> 2008 2009 2010 <strong>2011</strong>AntioquiaHuilaOtros*BolívarNariñoPutumayoCaldasRisaraldaQuindioCaucaSantan<strong>de</strong>rAmazonasChocóTolimaCaquetáCórdobaValle <strong>de</strong>l CaucaCundinamarcaGuaníaVaupésMagdalenaFuente: SIMCO.69GRÁFICA 12. PARTICIPACIÓN POR DEPARTAMENTOEN LA PRODUCCIÓN NACIONAL100%90%80%70%60%50%40%30%20%10%0%<strong>2007</strong> 2008 2009 2010 <strong>2011</strong>Antioquia Bolívar Córdoba Caldas Cauca ChocóGuanía Huila Nariño Putumayo Quindio RisaraldaSantan<strong>de</strong>r Tolima Valle <strong>de</strong>l Cauca Vaupés Otros* AmazonasFuente: SIMCO, Ingeominas <strong>2007</strong> - 2010 y Servicio Geológico Colombiano <strong>2011</strong>.


