

BoletÃn EstadÃstico de Minas y EnergÃa 2007 - 2011 - simco
BoletÃn EstadÃstico de Minas y EnergÃa 2007 - 2011 - simco
BoletÃn EstadÃstico de Minas y EnergÃa 2007 - 2011 - simco

Create successful ePaper yourself
Turn your PDF publications into a flip-book with our unique Google optimized e-Paper software.
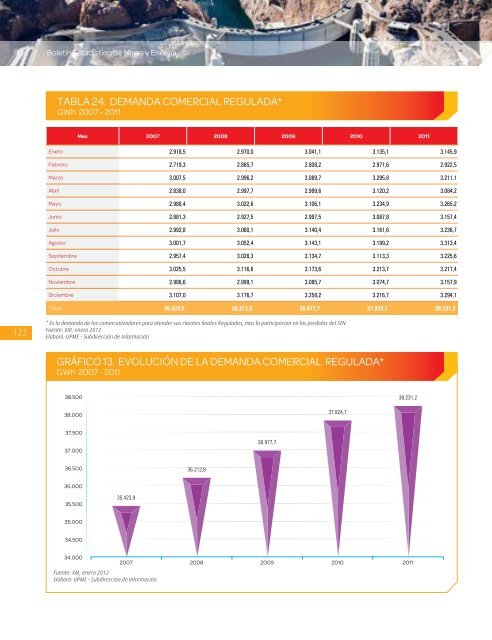
Boletín Estadístico <strong>de</strong> <strong>Minas</strong> y EnergíaTABLA 24. DEMANDA COMERCIAL REGULADA*GWh <strong>2007</strong> - <strong>2011</strong>Mes <strong>2007</strong> 2008 2009 2010 <strong>2011</strong>Enero 2.918,5 2.970,0 3.041,1 3.135,1 3.145,9Febrero 2.719,3 2.865,7 2.808,2 2.971,6 2.922,5Marzo 3.007,5 2.996,2 3.089,7 3.295,8 3.211,1Abril 2.838,0 2.997,7 2.999,6 3.120,2 3.084,2Mayo 2.988,4 3.022,6 3.106,1 3.234,9 3.265,2Junio 2.881,3 2.927,5 2.997,5 3.087,8 3.157,4Julio 2.992,8 3.060,1 3.140,4 3.161,6 3.236,7Agosto 3.001,7 3.052,4 3.143,1 3.199,2 3.313,4Septiembre 2.957,4 3.028,3 3.134,7 3.113,3 3.225,6Octubre 3.025,5 3.116,6 3.173,6 3.213,7 3.217,4Noviembre 2.986,6 2.999,1 3.085,7 3.074,7 3.157,9Diciembre 3.107,0 3.176,7 3.258,2 3.216,7 3.294,1Total 35.423,9 36.212,8 36.977,7 37.824,7 38.231,2122* Es la <strong>de</strong>manda <strong>de</strong> los comercializadores para aten<strong>de</strong>r sus clientes finales Regulados, mas la participacion en las perdidas <strong>de</strong>l STNFuente: XM, enero 2012Elaboró: UPME - Subdirección <strong>de</strong> InformaciónGRÁFICO 13. EVOLUCIÓN DE LA DEMANDA COMERCIAL REGULADA*GWh <strong>2007</strong> - <strong>2011</strong>38.50038.231,238.00037.824,737.50037.00036.977,736.50036.212,836.00035.50035.423,935.00034.50034.000Fuente: XM, enero 2012Elaboró: UPME - Subdirección <strong>de</strong> Información<strong>2007</strong> 2008 2009 2010 <strong>2011</strong>


