

BoletÃn EstadÃstico de Minas y EnergÃa 2007 - 2011 - simco
BoletÃn EstadÃstico de Minas y EnergÃa 2007 - 2011 - simco
BoletÃn EstadÃstico de Minas y EnergÃa 2007 - 2011 - simco

Create successful ePaper yourself
Turn your PDF publications into a flip-book with our unique Google optimized e-Paper software.
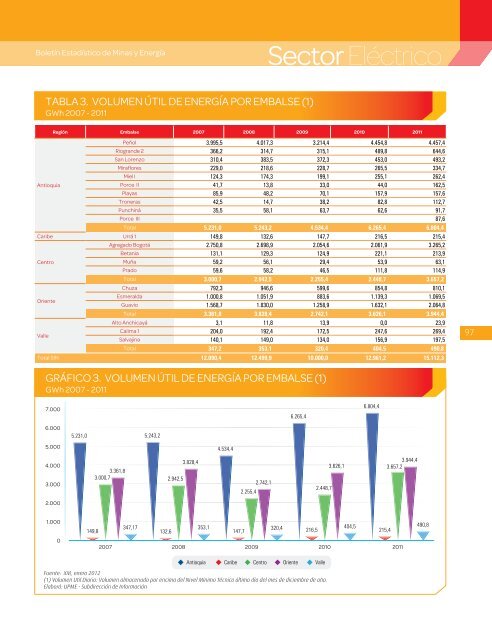
Boletín Estadístico <strong>de</strong> <strong>Minas</strong> y EnergíaSector EléctricoTABLA 3. VOLUMEN ÚTIL DE ENERGÍA POR EMBALSE (1)GWh <strong>2007</strong> - <strong>2011</strong>Región Embalse <strong>2007</strong> 2008 2009 2010 <strong>2011</strong>Peñol 3.995,5 4.017,3 3.214,4 4.454,8 4.457,4Riogran<strong>de</strong> 2 366,2 314,7 315,1 489,8 644,6San Lorenzo 310,4 383,5 372,3 453,0 493,2Miraflores 229,0 218,6 228,7 265,5 334,7Miel I 124,3 174,3 199,1 255,1 262,4AntioquiaPorce II 41,7 13,8 33,0 44,0 162,5Playas 85,9 48,2 70,1 157,9 157,6Troneras 42,5 14,7 38,2 82,8 112,7Punchiná 35,5 58,1 63,7 62,6 91,7Porce III 87,6Total 5.231,0 5.243,2 4.534,4 6.265,4 6.804,4Caribe Urrá 1 149,8 132,6 147,7 216,5 215,4Agregado Bogotá 2.750,8 2.698,9 2.054,6 2.061,9 3.265,2Betania 131,1 129,3 124,9 221,1 213,9CentroMuña 59,2 56,1 29,4 53,9 63,1Prado 59,6 58,2 46,5 111,8 114,9Total 3.000,7 2.942,5 2.255,4 2.448,7 3.657,2Chuza 792,3 946,6 599,6 854,8 810,1OrienteEsmeralda 1.000,8 1.051,9 883,6 1.139,3 1.069,5Guavio 1.568,7 1.830,0 1.258,9 1.632,1 2.064,8Total 3.361,8 3.828,4 2.742,1 3.626,1 3.944,4Alto Anchicayá 3,1 11,8 13,9 0,0 23,9ValleCalima 1 204,0 192,4 172,5 247,6 269,4Salvajina 140,1 149,0 134,0 156,9 197,5Total 347,2 353,1 320,4 404,5 490,8Total SIN 12.090,4 12.499,9 10.000,0 12.961,2 15.112,397GRÁFICO 3. VOLUMEN ÚTIL DE ENERGÍA POR EMBALSE (1)8.000 GWh <strong>2007</strong> - <strong>2011</strong>7.0006.265,46.804,46.0005.231,0 5.243,25.0004.534,44.0003.0003.828,43.361,83.000,7 2.942,52.742,12.255,42.448,73.626,13.944,43.657,22.0001.0000347,17 353,1 320,4 404,5 490,8149,8 132,6 147,7 216,5 215,4<strong>2007</strong> 2008 2009 2010 <strong>2011</strong>Antioquia Caribe Centro Oriente ValleFuente: XM, enero 2012(1) Volumen Util Diario: Volumen almacenado por encima <strong>de</strong>l Nivel Mínimo Técnico último día <strong>de</strong>l mes <strong>de</strong> diciembre <strong>de</strong> año.Elaboró: UPME - Subdirección <strong>de</strong> Información


