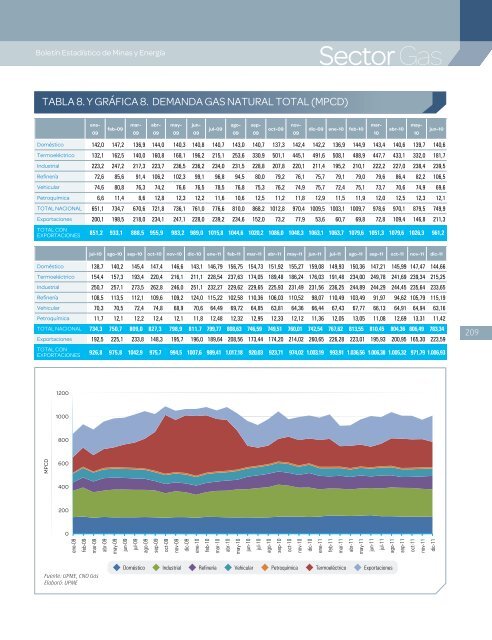
Boletín Estadístico <strong>de</strong> <strong>Minas</strong> y EnergíaSector GasTABLA 8. Y GRÁFICA 8. DEMANDA GAS NATURAL TOTAL (MPCD)09feb-0909090909jul-090909oct-0909dic-09 ene-10 feb-1010abr-10ene-mar-abr-may-jun-ago-sep-nov-mar-may-10jun-10Doméstico 142,0 147,2 136,9 144,0 140,3 140,8 140,7 143,0 140,7 137,3 142,4 142,2 136,9 144,9 143,4 140,6 139,7 140,6Termoeléctrico 132,1 162,5 140,0 160,8 168,1 196,2 215,1 253,6 330,9 501,1 445,1 491,6 508,1 488,9 447,7 433,1 332,0 181,7Industrial 223,2 247,2 217,3 223,7 236,5 236,2 234,0 231,5 228,8 207,8 220,1 211,4 195,2 210,1 222,2 227,0 238,4 239,5Refinería 72,6 85,6 91,4 106,2 102,3 99,1 96,8 94,5 80,0 79,2 76,1 75,7 79,1 79,0 79,6 86,4 82,2 106,5Vehicular 74,6 80,8 76,3 74,2 76,6 76,5 78,5 76,8 75,3 76,2 74,9 75,7 72,4 75,1 73,7 70,6 74,9 69,6Petroquímica 6,6 11,4 8,6 12,8 12,3 12,2 11,6 10,6 12,5 11,2 11,8 12,9 11,5 11,9 12,0 12,5 12,3 12,1TOTAL NACIONAL 651,1 734,7 670,6 721,8 736,1 761,0 776,6 810,0 868,2 1012,8 970,4 1009,5 1003,1 1009,7 978,6 970,1 879,5 749,9Exportaciones 200,1 198,5 218,0 234,1 247,1 228,0 239,2 234,6 152,0 73,2 77,9 53,6 60,7 69,8 72,8 109,4 146,8 211,3TOTAL CONEXPORTACIONES 851,2 933,1 888,5 955,9 983,2 989,0 1015,8 1044,6 1020,2 1086,0 1048,3 1063,1 1063,7 1079,6 1051,3 1079,6 1026,3 961,2jul-10 ago-10 sep-10 oct-10 nov-10 dic-10 ene-11 feb-11 mar-11 abr-11 may-11 jun-11 jul-11 ago-11 sep-11 oct-11 nov-11 dic-11Doméstico 138,7 140,2 145,4 147,4 146,6 143,1 146,79 156,75 154,73 151,92 155,27 159,08 149,93 150,36 147,21 145,99 147,47 144,66Termoeléctrico 154,4 157,3 193,4 220,4 216,1 211,1 228,54 237,63 174,05 189,48 186,24 176,03 191,48 234,00 249,78 241,69 239,34 215,25Industrial 250,7 257,1 273,5 262,8 246,0 251,1 232,27 229,62 229,65 225,93 231,49 231,56 236,25 244,89 244,29 244,45 235,64 233,65Refinería 108,5 113,5 112,1 109,6 109,2 124,0 115,22 102,58 110,36 106,03 110,52 98,07 110,49 103,49 91,97 94,62 105,79 115,19Vehicular 70,3 70,5 72,4 74,8 68,9 70,6 64,49 69,72 64,85 63,81 64,36 66,44 67,43 67,77 66,13 64,91 64,94 63,16Petroquímica 11,7 12,1 12,2 12,4 12,1 11,8 12,48 12,32 12,95 12,33 12,12 11,36 12,05 13,05 11,08 12,69 13,31 11,42TOTAL NACIONAL 734,3 750,7 809,0 827,3 798,9 811,7 799,77 808,63 746,59 749,51 760,01 742,54 767,62 813,55 810,45 804,36 806,49 783,34Exportaciones 192,5 225,1 233,8 148,3 195,7 196,0 189,64 208,56 173,44 174,20 214,02 260,65 226,28 223,01 195,93 200,95 165,30 223,59TOTAL CONEXPORTACIONES 926,8 975,8 1042,9 975,7 994,5 1007,6 989,41 1.017,18 920,03 923,71 974,02 1.003,19 993,91 1.036,56 1.006,38 1.005,32 971,79 1.006,9320912001000800MPCD600400ene-09feb-09mar-09abr-09may-09jun-09jul-09ago-09sep-09oct-09nov-09dic-09ene-10feb-10mar-10abr-10may-10jun-10jul-10ago-10sep-10oct-10nov-10dic-10ene-11feb-11mar-11abr-11may-11jun-11jul-11ago-11sep-11oct-11nov-11dic-112000Fuente: UPME, CNO GasElaboró: UPMEDoméstico Industrial Refinería Vehicular Petroquímica Termoeléctrico Exportaciones
Boletín Estadístico <strong>de</strong> <strong>Minas</strong> y EnergíaTABLA 9. COBERTURA DEL SERVICIO DE GAS NATURALIV TRIMESTRE DE <strong>2011</strong>210No NoPOBLACIONES CONSERVICIODIVISION POLITICO-ADMINISTRATIVADEPTO.CATASTROTOTAL USUARIOSRESIDENCIALESANILLADOSUSUARIOS RESIDENCIALESCONECTADOS POR ESTRATOTOTAL USUARIOSRESIDENCIALESCONECTADOSTOTAL USUARIOSCOMERCIALESTOTAL USUARIOSINDUSTRIALE STOTAL USUARIOS GASNATURALCOBERTURARESIDENCIAL %1 2 3 4 5 6 Potencial EfectivaALCANOS DE COLOMBIA (ZONA CENTRO TOLIMA)1 1 Alvarado Municipio Tolima 947 943 211 538 3 0 0 0 752 4 0 756 99,6% 79,4%2 2 Ambalema Municipio Tolima 1.764 1.741 750 578 67 0 0 0 1.395 4 0 1.399 98,7% 79,1%3 3Armero-GuayabalMunicipio Tolima 3.086 2.863 1.204 1.197 5 0 0 0 2.406 15 0 2.421 92,8% 78,0%4 4 Chicoral Corregimiento Tolima 1.607 1.485 241 891 161 0 0 0 1.293 8 1 1.302 92,4% 80,5%5 5 Doima Corregimiento Tolima 278 274 91 127 0 0 0 0 218 1 0 219 98,6% 78,4%6 6 Espinal Municipio Tolima 15.144 14.617 2.286 6.183 2.534 408 1 1 11.413 103 7 11.523 96,5% 75,4%7 7 Flan<strong>de</strong>s Municipio Tolima 14.273 9.686 167 3.009 2.277 2 0 0 5.455 36 1 5.492 67,9% 38,2%8 8 Fresno Municipio Tolima 3.738 3.689 895 2.017 739 1 0 0 3.652 31 0 3.683 98,7% 97,7%9 9 Girardot Municipio Cundinamarca 25.570 23.969 1.712 7.675 5.658 597 84 0 15.726 173 1 15.900 93,7% 61,5%10 10 Herveo Municipio Tolima 1.247 1.101 324 691 5 0 0 0 1.020 5 0 1.025 88,3% 81,8%11 11 Honda Municipio Tolima 8.129 6.820 1.442 3.400 533 76 1 0 5.452 45 0 5.497 83,9% 67,1%12 12 Ibague Municipio Tolima 120.524 118.872 16.965 56.114 29.420 8.038 1.122 209 111.868 1.021 25 112.914 98,6% 92,8%13 13 La Dorada Municipio Caldas 17.267 16.247 2.762 8.636 2.076 95 1 0 13.570 91 1 13.662 94,1% 78,6%14 14 La Sierra Corregimiento Tolima 417 405 293 75 0 0 0 0 368 0 1 369 97,1% 88,2%15 15 Lerida Municipio Tolima 4.222 4.081 766 2.999 72 0 0 0 3.837 17 0 3.854 96,7% 90,9%16 16 Libano Municipio Tolima 6.935 6.515 646 3.503 1.580 162 0 0 5.891 48 0 5.939 93,9% 84,9%17 17 Manzanares Municipio Caldas 2.499 2.326 449 1.347 258 12 0 0 2.066 23 0 2.089 93,1% 82,7%18 18 Mariquita Municipio Tolima 7.827 7.591 2.812 3.381 360 36 1 0 6.590 68 2 6.660 97,0% 84,2%19 19 Piedras Municipio Tolima 588 571 167 343 0 0 0 0 510 2 0 512 97,1% 86,7%20 20 Pto Salgar Municipio Cundinamarca 3.150 2.929 1.376 651 156 0 0 0 2.183 18 0 2.201 93,0% 69,3%21 21 Puerto Boyaca Municipio Boyaca 8.290 8.153 1.515 4.413 1.474 0 0 0 7.402 58 0 7.460 98,3% 89,3%22 22 Ricaurte Municipio Cundinamarca 3.563 1.607 241 92 394 43 1 0 771 26 0 797 45,1% 21,6%23 23 San Luis Municipio Tolima 2.158 2.084 831 1.007 8 0 2 0 1.848 7 0 1.855 96,6% 85,6%24 24 Tierra<strong>de</strong>ntro Corregimiento Tolima 58 58 18 22 0 0 0 0 40 0 0 40 100,0% 69,0%25 25 Venadillo Municipio Tolima 2.564 2.464 1.015 1.157 6 0 0 0 2.178 15 0 2.193 96,1% 84,9%26 26 Victoria Municipio Caldas 1.325 1.286 502 479 185 1 0 0 1.167 7 0 1.174 97,1% 88,1%Subtotal 257.170 242.377 39.681 110.525 47.971 9.471 1.213 210 209.071 1.826 39 210.936 94,2% 81,3%ALCANOS DE COLOMBIA SA ESP (ZONA HUILA SUR TOLIMA)27 1 Agua De Dios Municipio Cundinamarca 4.179 3.303 381 1.836 70 0 0 0 2.287 14 0 2.301 79,0% 54,7%28 2 Aipe Municipio Huila 2.750 2.737 791 1.674 146 5 0 0 2.616 11 0 2.627 99,5% 95,1%29 3 Algeciras Municipio Huila 3.289 3.269 1084 1.298 79 0 0 0 2.461 17 0 2.478 99,4% 74,8%30 4 Apulo Municipio Cundinamarca 1.576 1.286 152 546 143 0 0 0 841 1 0 842 81,6% 53,4%31 5 Arbelaez Municipio Cundinamarca 1.768 1.317 12 580 267 82 1 0 942 20 0 962 74,5% 53,3%32 6 Baraya Municipio Huila 1.226 1.176 659 268 40 0 0 0 967 9 0 976 95,9% 78,9%33 7 Betania Corregimiento Huila 170 169 90 68 1 0 0 0 159 0 0 159 99,4% 93,5%34 8 Caguan Corregimiento Huila 1.638 1.501 911 472 0 0 0 0 1.383 8 0 1.391 91,6% 84,4%35 9 Campoalegre Municipio Huila 7.382 7.286 3140 2.869 497 0 0 0 6.506 37 1 6.544 98,7% 88,1%36 10 Carmen Apicala Municipio Tolima 2.969 2.877 131 1.332 328 57 24 0 1.872 29 0 1.901 96,9% 63,1%37 11 Carmen Vivoral Municipio Antioquia 7.802 6.074 59 951 730 0 0 0 1.740 13 0 1.753 77,9% 22,3%38 12 Chaparral Municipio Tolima 8.470 7.652 2088 2.402 695 2 0 0 5.187 48 0 5.235 90,3% 61,2%39 13 Florencia Municipio Caqueta 41.664 37.317 17204 7.399 1.014 205 0 0 25.822 36 0 25.858 89,6% 62,0%40 14 Fortalecillas Corregimiento Huila 824 778 364 371 4 0 0 0 739 13 3 755 94,4% 89,7%41 15 Fusagasuga Municipio Cundinamarca 29.843 29.039 3159 9.342 4.733 4.798 132 1 22.165 216 0 22.381 97,3% 74,3%42 16 Garzon Municipio Huila 9.795 9.556 2265 3.940 1.640 144 1 1 7.991 59 0 8.050 97,6% 81,6%43 17 Gigante Municipio Huila 4.189 4.083 1193 2.228 120 0 0 0 3.541 22 0 3.563 97,5% 84,5%44 18 Guacirco Vereda Huila 167 167 118 39 1 0 0 0 158 0 0 158 100,0% 94,6%45 19 Guaduas Municipio Cundinamarca 3.384 935 95 154 0 0 0 0 249 0 0 249 27,6% 7,4%46 20 Gualanday Corregimiento Tolima 415 376 88 152 36 0 0 0 276 3 0 279 90,6% 66,5%47 21 Guamo Municipio Tolima 4.832 4.737 1070 2.580 197 0 0 0 3.847 20 0 3.867 98,0% 79,6%48 22 Guarne Municipio Antioquia 4.840 4.181 50 769 893 17 0 0 1.729 14 0 1.743 86,4% 35,7%49 23 Hobo Municipio Huila 1.945 1.753 607 640 3 0 0 0 1.250 5 1 1.256 90,1% 64,3%50 24 Icononzo Municipio Cundinamarca 1.386 1.265 316 641 6 0 0 0 963 15 0 978 91,3% 69,5%51 25 Juncal Corregimiento Huila 725 696 100 501 4 0 0 0 605 3 0 608 96,0% 83,4%